IBOV 192,114.55 ▲ 2.63% IPSA 10,990.15 ▲ 0.67% IPC MEX 64,531.68 ▲ 1.10% MERVAL 2,767,663 ▲ 0.32% COLCAP 2,515.02 ▼ 0.59% BVL PERÚ 59,751.67 ▲ 0.18% USD/BRL4.98▼ 4.48% USD/MXN18.09▼ 0.45% USD/CLP970.87▼ 1.98% USD/COP3,225▼ 0.90% USD/PEN3.44▲ 0.17% USD/ARS1,524▼ 0.04% USD/UYU40.34▼ 0.30% USD/PYG5,844▲ 0.40% USD/BOB11.95▲ 0.17% USD/DOP60.17▲ 0.45% USD/CRC455.71▼ 0.15% USD/GTQ7.63▼ 0.09% USD/HNL26.86▼ 0.01% USD/NIO36.62— 0.00% USD/VES869.19▼ 0.13% USD/PAB1.00— 0.00% USD/BZD2.00— 0.00% USD/JMD 157.28 — 0.00% USD/TTD6.68▼ 0.14% EUR/BRL5.59▼ 5.10% BRENT 88.88 ▼ 0.03% WTI 83.11 ▼ 0.11% IRON ORE 161.91 — — COPPER 6.61 ▲ 0.03% GOLD 4,461 ▲ 1.78% SILVER 65.59 ▲ 1.26% SOY 1,184 ▲ 3.20% CORN 480.50 ▲ 10.02% WHEAT 655.00 ▲ 3.93% COFFEE 317.25 ▼ 5.51% SUGAR 16.43 ▼ 1.79% ORANGE JUICE 138.55 ▼ 0.47% COTTON 85.03 ▲ 2.33% COCOA 5,719 ▲ 3.18% BEEF 223.60 ▼ 3.93% CATTLE 339.10 ▼ 3.16% LITHIUM 75.20 ▲ 1.47% PETR4 41.64 ▼ 0.05% VALE3 72.97 ▲ 0.83% ITUB4 38.60 ▼ 1.03% BBDC4 16.85 ▲ 0.36% ABEV3 14.89 ▼ 0.80% BBAS3 19.37 ▲ 0.47% B3SA3 14.26 ▼ 0.21% WEGE3 47.59 ▲ 0.49% PRIO3 59.14 ▼ 0.19% SUZB3 41.33 ▲ 2.35% RENT3 34.68 ▼ 0.09% AZZA3 15.89 ▼ 2.63% CSAN3 3.22 ▼ 1.83% RAIZ4 0.25 — 0.00% PCAR3 2.75 ▼ 0.36% GMAT3 3.65 ▼ 1.08% PSSA3 48.13 ▼ 0.54% CVCB3 1.33 ▼ 2.92% POSI3 3.36 ▲ 2.44% SLCE3 13.34 ▲ 0.30% NATU3 8.14 ▼ 0.73% IBOV 192,114.55 ▲ 2.63% IPSA 10,990.15 ▲ 0.67% IPC MEX 64,531.68 ▲ 1.10% MERVAL 2,767,663 ▲ 0.32% COLCAP 2,515.02 ▼ 0.59% BVL PERÚ 59,751.67 ▲ 0.18% USD/BRL 5.16 ▲ 0.01% USD/MXN 17.06 ▼ 0.24% USD/CLP 913.98 ▲ 0.04% USD/COP 3,140 ▲ 0.03% USD/PEN 3.36 ▼ 0.66% USD/ARS 1,493 ▲ 0.10% USD/UYU 40.27 ▲ 1.24% USD/PYG 5,939 ▲ 1.68% USD/BOB 11.64 ▼ 0.76% USD/DOP 58.34 ▲ 1.25% USD/CRC 445.92 ▲ 0.89% USD/GTQ 7.62 ▲ 2.21% USD/HNL 26.79 ▲ 1.57% USD/NIO 36.62 ▲ 0.69% USD/VES 762.44 ▼ 0.13% USD/PAB 1.00 — 0.00% USD/BZD 2.00 — 0.00% USD/JMD 157.28 — 0.00% USD/TTD 6.70 ▲ 0.61% EUR/BRL 5.95 ▲ 1.01% BRENT 88.88 ▼ 0.03% WTI 83.11 ▼ 0.11% IRON ORE 161.91 — — COPPER 6.61 ▲ 0.03% GOLD 4,461 ▲ 1.78% SILVER 65.59 ▲ 1.26% SOY 1,184 ▲ 3.20% CORN 480.50 ▲ 10.02% WHEAT 655.00 ▲ 3.93% COFFEE 317.25 ▼ 5.51% SUGAR 16.43 ▼ 1.79% ORANGE JUICE 138.55 ▼ 0.47% COTTON 85.03 ▲ 2.33% COCOA 5,719 ▲ 3.18% BEEF 223.60 ▼ 3.93% CATTLE 339.10 ▼ 3.16% LITHIUM 75.20 ▲ 1.47% PETR4 41.64 ▼ 0.05% VALE3 72.97 ▲ 0.83% ITUB4 38.60 ▼ 1.03% BBDC4 16.85 ▲ 0.36% ABEV3 14.89 ▼ 0.80% BBAS3 19.37 ▲ 0.47% B3SA3 14.26 ▼ 0.21% WEGE3 47.59 ▲ 0.49% PRIO3 59.14 ▼ 0.19% SUZB3 41.33 ▲ 2.35% RENT3 34.68 ▼ 0.09% AZZA3 15.89 ▼ 2.63% CSAN3 3.22 ▼ 1.83% RAIZ4 0.25 — 0.00% PCAR3 2.75 ▼ 0.36% GMAT3 3.65 ▼ 1.08% PSSA3 48.13 ▼ 0.54% CVCB3 1.33 ▼ 2.92% POSI3 3.36 ▲ 2.44% SLCE3 13.34 ▲ 0.30% NATU3 8.14 ▼ 0.73%
since 2009
Monday, October 5, 2026

World Business - Brazil

The New Leviathans: How a $5 Trillion Nvidia Redefines Global Economic Power

By · October 29, 2025 · 2 min read

In a landmark moment for the global economy, the American chipmaker Nvidia has cemented its status as the world’s most valuable company, reaching a market valuation of $5 trillion.

This achievement underscores a seismic shift in economic power from traditional industrial giants to technology firms driving the artificial intelligence revolution.

Nvidia’s ascent is unprecedented. It took just over three months for the company to climb from a $4 trillion valuation to this new peak, a velocity that highlights the explosive demand for its advanced semiconductors, which are the bedrock of AI systems worldwide.

The company now leads a cohort of U.S. tech titans, with Microsoft and Apple following closely, each valued at approximately $4 trillion.

To grasp the scale of this corporate behemoth, consider its weight against national economies. The collective market capitalization of the leading U.S. tech giants—Apple, Microsoft, Nvidia, Alphabet, Amazon, Meta, and Tesla—has surged beyond $18 trillion.
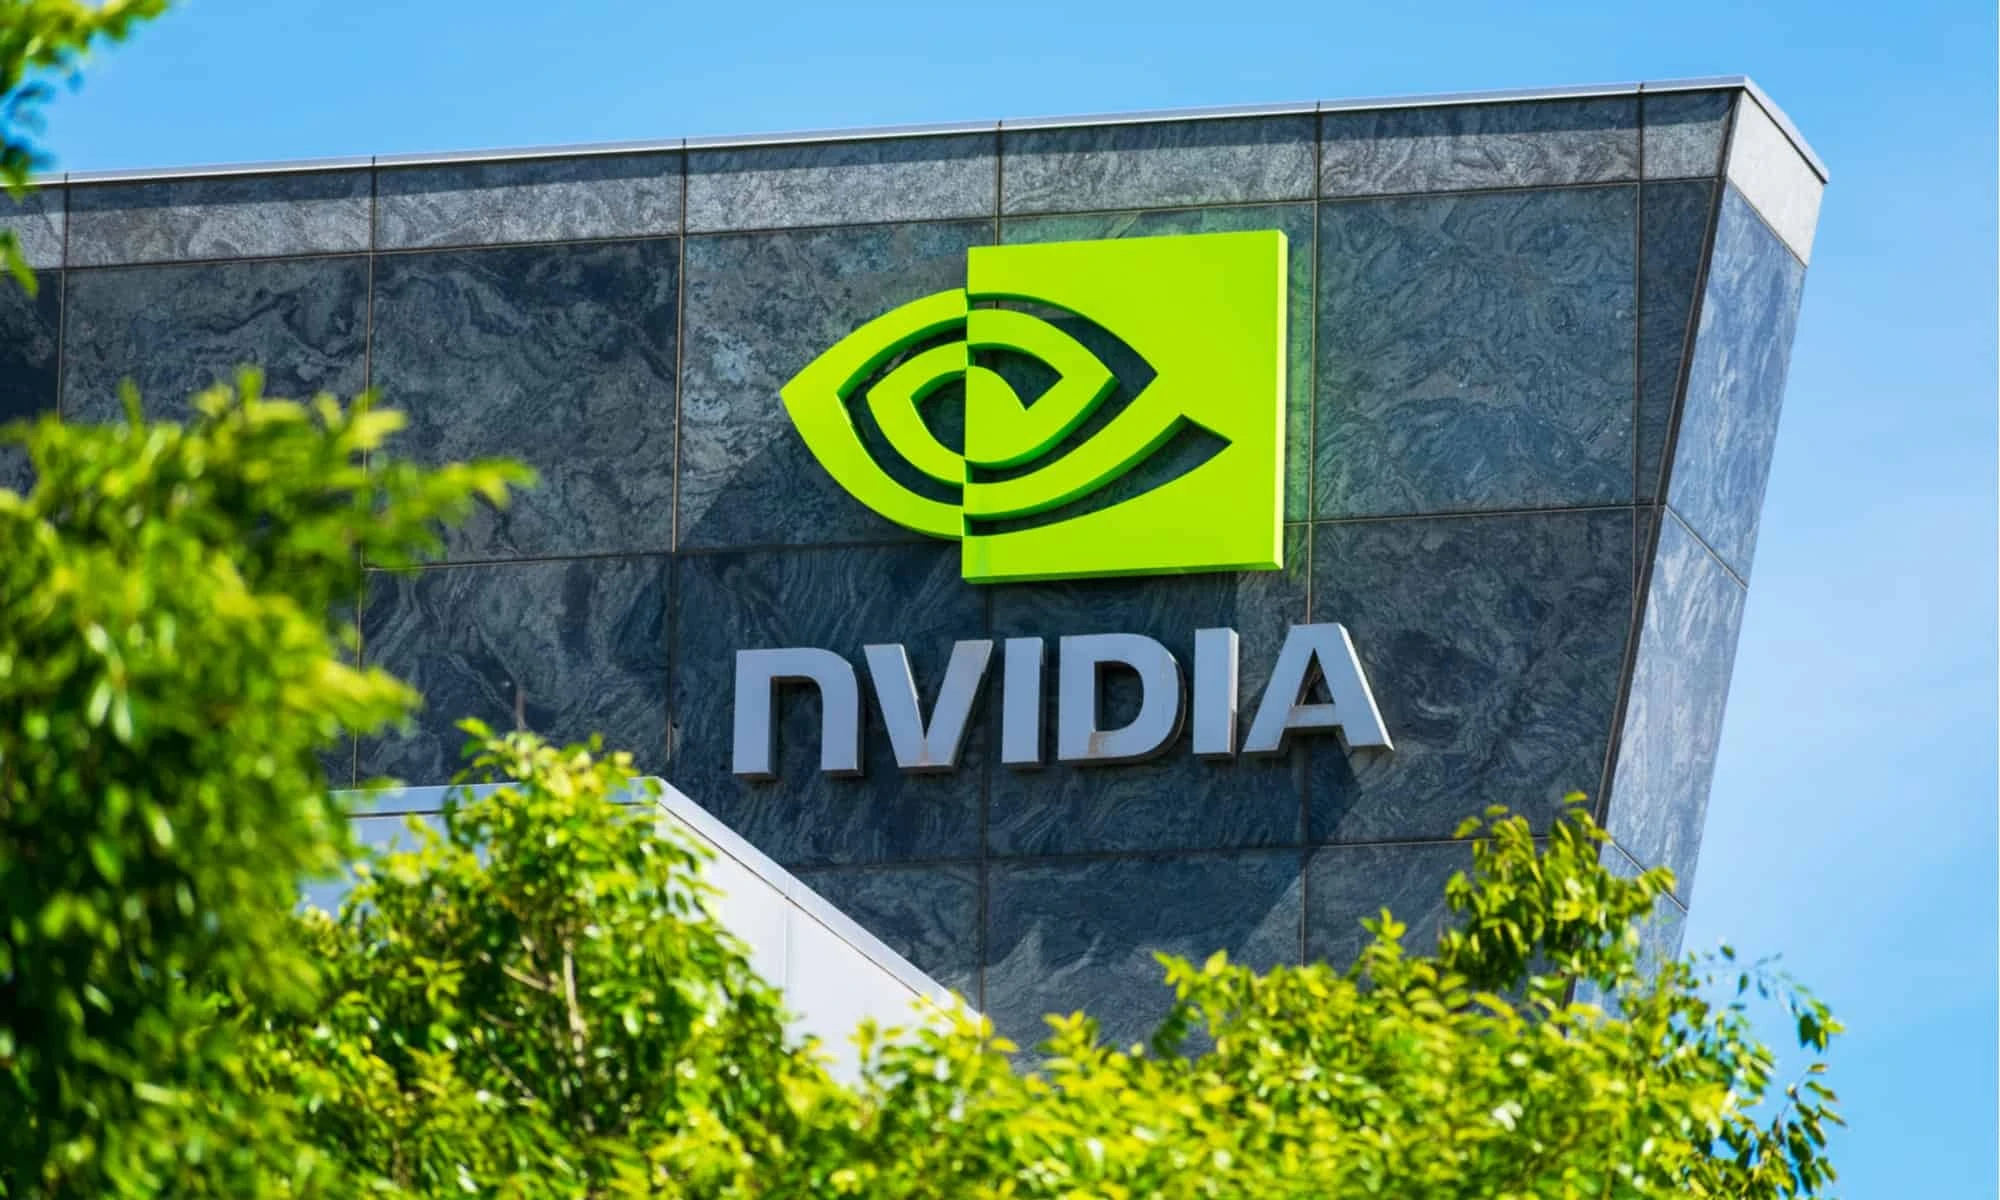
The New Leviathans: How a $5 Trillion Nvidia Redefines Global Economic Power
One-stop reference
Company Intelligence
Every listed company in Latin America — financials, ownership and structure for 1,450+ companies across 26 exchanges, in one place.
Browse the directory →

The New Leviathans: How a $5 Trillion Nvidia Redefines Global Economic Power

This figure surpasses the annual Gross Domestic Product of every country on earth except the United States and China.

The LatAm Brief

One email, every weekday morning. What moved in Latin American markets, politics and expat life.

Yesterday’s subject line: “Brazil runoff set: Flávio 47%, Lula 45%, 25 October”

Free. We send a confirmation link first — nothing arrives until you click it. Unsubscribe with one click in any edition. If you stop opening us for 30 days we stop sending by ourselves, as we assume the interest is no longer there. See our privacy policy. We never share your email.

A single company, Nvidia, now commands a value greater than the entire economic output of major nations like Brazil.

This concentration of market value in a handful of tech corporations invites historical parallels to the great trading companies of the colonial era, such as the Dutch and English East India Companies.

https://www.riotimesonline.com/ais-imperial-quest-echoes-of-the-east-india-companys-ruin/

Those entities were granted unprecedented power and influence by their states, shaping global trade and politics for centuries.

Similarly, today’s tech giants wield immense economic and technological influence, shaping the future of global communication, commerce, and intelligence.

For Brazil and the world, this signifies more than a stock market milestone. It represents a fundamental restructuring of the global economic order, where the engines of data and artificial intelligence are becoming as central to modern power as the spice and trade routes were in the past.

The decisions made in the boardrooms of these tech companies will undoubtedly have profound implications for international economies, including Brazil’s, for years to come.

Live Market IntelligenceBrazil — Live Market BoardInside: market breadth, the sector heatmap, currencies & rates, the Latin America scoreboard and the full instrument board.

Rio Times · Live Market Intelligence

Brazil — Live Market Board

B3 · São Paulo
Oct 5, 2026 · 10:23

Ibovespa · benchmark
192,114.55
+2.63%
L 167,142day rangeH 168,310

+21.85% over 12 months

Market breadth · 15 names
47% advancing

7 ▲ advancing8 declining ▼

Currencies, rates & key inputs
USD / BRL
5.16
+0.01%

EUR / BRL
5.95
+1.01%

Selic rate
14.00%
·

Brent crude
88.88
-0.03%

Iron ore
161.91
·

Sector heatmap · average move today
Materials
+2.35%
SUZB3

Mining
+1.16%
VALE3, CSNA3, GGBR4

Industrials
+0.20%
WEGE3, RENT3

Financials
-0.10%
ITUB4, BBDC4, BBAS3, B3SA3

Energy
-0.12%
PETR4, PRIO3

Consumer Staples
-0.80%
ABEV3

Utilities
-1.38%
ENEV3

Consumer Disc.
-2.63%
AZZA3

Latin America scoreboard
IndexLastTodayStrength
IbovespaBrazil
192,114.55
+2.63%

S&P/BMV IPCMexico
64,531.68
+1.10%

S&P IPSAChile
10,990.15
+0.67%

S&P MERVALArgentina
2,767,663
+0.32%

MSCI COLCAPColombia
2,515.02
-0.59%

BVL S&P PerúPeru
59,751.67
+0.18%

Full instrument board
Instrument Last Change YoY Prev. High Low Volume
IBOV 192,114.55 +2.63% +21.85% 187,197.46 168,310 167,142 —
USD/BRL 5.16 +0.01% -5.13% 5.16 5.18 5.14 —
SELIC 14.00% — — — — —
PETR4 41.64 -0.05% +35.19% 41.66 41.97 41.15 41,499,400
VALE3 72.97 +0.83% +30.75% 72.37 73.54 72.66 17,658,000
ITUB4 38.60 -1.03% +4.57% 39.00 39.34 38.39 29,487,800
BBDC4 16.85 +0.36% +3.50% 16.79 16.90 16.67 19,416,900
BBAS3 19.37 +0.47% +0.73% 19.28 19.44 19.16 11,069,200
B3SA3 14.26 -0.21% +12.73% 14.29 14.47 14.11 33,037,800
ABEV3 14.89 -0.80% +21.91% 15.01 15.07 14.81 16,453,100
WEGE3 47.59 +0.49% +29.99% 47.36 48.08 47.36 3,364,600
PRIO3 59.14 -0.19% +50.67% 59.25 59.81 58.74 3,325,600
SUZB3 41.33 +2.35% -23.55% 40.38 41.48 40.35 3,914,900
RENT3 34.68 -0.09% +0.84% 34.71 34.96 34.35 7,979,100
AZZA3 15.89 -2.63% -53.76% 16.32 16.42 15.82 1,330,300
CSNA3 4.30 +0.47% -42.65% 4.28 4.41 4.26 10,076,100
GGBR4 24.69 +2.19% +51.38% 24.16 24.85 24.18 7,047,600
ENEV3 24.21 -1.38% +70.49% 24.55 24.64 23.99 9,297,000

Largest moves today
IBOV
192,114.55
+2.63%
AZZA3
15.89
-2.63%
SUZB3
41.33
+2.35%
GGBR4
24.69
+2.19%
ENEV3
24.21
-1.38%
ITUB4
38.60
-1.03%
VALE3
72.97
+0.83%
ABEV3
14.89
-0.80%

The session read
The Ibovespa rose 2.63%, with breadth negative — 7 of 15 names higher. Materials led, while Consumer Disc. lagged.

This article was produced by The Rio Times’ automated newsroom system. How we use AI · Report an error · Editorial responsibility: Matthias Camenzind, Editor-in-Chief

LatAm Markets: Live Signals → — real-time movers, turnover leaders and FX across Latin America.

Rotate for Best Experience

This report is optimized for landscape viewing. Rotate your phone for the full experience.