IBOV 205,336.15 ▼ 0.24% IPSA 11,008.02 ▼ 1.40% IPC MEX 65,312.46 ▲ 0.52% MERVAL 2,830,087 ▼ 2.31% COLCAP 2,565.97 ▼ 0.89% BVL PERÚ 60,766.81 ▼ 0.51% USD/BRL4.99▲ 0.19% USD/MXN17.99▲ 0.01% USD/CLP976.88▲ 0.42% USD/COP3,225▲ 0.53% USD/PEN3.45— 0.00% USD/ARS1,522▲ 0.06% USD/UYU40.09▲ 2.39% USD/PYG5,835▲ 3.05% USD/BOB11.87▲ 2.15% USD/DOP60.28▲ 3.68% USD/CRC453.46▲ 2.32% USD/GTQ7.64▲ 3.39% USD/HNL26.86▲ 0.86% USD/NIO36.62▲ 0.26% USD/VES871.68▼ 0.13% USD/PAB1.00— 0.00% USD/BZD2.00— 0.00% USD/JMD 157.28 — 0.00% USD/TTD6.70▲ 2.23% EUR/BRL5.59▼ 0.32% BRENT 88.88 ▼ 0.03% WTI 83.11 ▼ 0.11% IRON ORE 161.91 — — COPPER 6.61 ▲ 0.03% GOLD 4,461 ▲ 1.78% SILVER 65.59 ▲ 1.26% SOY 1,184 ▲ 3.20% CORN 480.50 ▲ 10.02% WHEAT 655.00 ▲ 3.93% COFFEE 317.25 ▼ 5.51% SUGAR 16.43 ▼ 1.79% ORANGE JUICE 138.55 ▼ 0.47% COTTON 85.03 ▲ 2.33% COCOA 5,719 ▲ 3.18% BEEF 223.60 ▼ 3.93% CATTLE 339.10 ▼ 3.16% LITHIUM 75.20 ▲ 1.47% PETR4 41.64 ▼ 0.05% VALE3 72.97 ▲ 0.83% ITUB4 38.60 ▼ 1.03% BBDC4 16.85 ▲ 0.36% ABEV3 14.89 ▼ 0.80% BBAS3 19.37 ▲ 0.47% B3SA3 14.26 ▼ 0.21% WEGE3 47.59 ▲ 0.49% PRIO3 59.14 ▼ 0.19% SUZB3 41.33 ▲ 2.35% RENT3 34.68 ▼ 0.09% AZZA3 15.89 ▼ 2.63% CSAN3 3.22 ▼ 1.83% RAIZ4 0.25 — 0.00% PCAR3 2.75 ▼ 0.36% GMAT3 3.65 ▼ 1.08% PSSA3 48.13 ▼ 0.54% CVCB3 1.33 ▼ 2.92% POSI3 3.36 ▲ 2.44% SLCE3 13.34 ▲ 0.30% NATU3 8.14 ▼ 0.73% IBOV 205,336.15 ▼ 0.24% IPSA 11,008.02 ▼ 1.40% IPC MEX 65,312.46 ▲ 0.52% MERVAL 2,830,087 ▼ 2.31% COLCAP 2,565.97 ▼ 0.89% BVL PERÚ 60,766.81 ▼ 0.51% USD/BRL 5.16 ▲ 0.01% USD/MXN 17.06 ▼ 0.24% USD/CLP 913.98 ▲ 0.04% USD/COP 3,140 ▲ 0.03% USD/PEN 3.36 ▼ 0.66% USD/ARS 1,493 ▲ 0.10% USD/UYU 40.27 ▲ 1.24% USD/PYG 5,939 ▲ 1.68% USD/BOB 11.64 ▼ 0.76% USD/DOP 58.34 ▲ 1.25% USD/CRC 445.92 ▲ 0.89% USD/GTQ 7.62 ▲ 2.21% USD/HNL 26.79 ▲ 1.57% USD/NIO 36.62 ▲ 0.69% USD/VES 762.44 ▼ 0.13% USD/PAB 1.00 — 0.00% USD/BZD 2.00 — 0.00% USD/JMD 157.28 — 0.00% USD/TTD 6.70 ▲ 0.61% EUR/BRL 5.95 ▲ 1.01% BRENT 88.88 ▼ 0.03% WTI 83.11 ▼ 0.11% IRON ORE 161.91 — — COPPER 6.61 ▲ 0.03% GOLD 4,461 ▲ 1.78% SILVER 65.59 ▲ 1.26% SOY 1,184 ▲ 3.20% CORN 480.50 ▲ 10.02% WHEAT 655.00 ▲ 3.93% COFFEE 317.25 ▼ 5.51% SUGAR 16.43 ▼ 1.79% ORANGE JUICE 138.55 ▼ 0.47% COTTON 85.03 ▲ 2.33% COCOA 5,719 ▲ 3.18% BEEF 223.60 ▼ 3.93% CATTLE 339.10 ▼ 3.16% LITHIUM 75.20 ▲ 1.47% PETR4 41.64 ▼ 0.05% VALE3 72.97 ▲ 0.83% ITUB4 38.60 ▼ 1.03% BBDC4 16.85 ▲ 0.36% ABEV3 14.89 ▼ 0.80% BBAS3 19.37 ▲ 0.47% B3SA3 14.26 ▼ 0.21% WEGE3 47.59 ▲ 0.49% PRIO3 59.14 ▼ 0.19% SUZB3 41.33 ▲ 2.35% RENT3 34.68 ▼ 0.09% AZZA3 15.89 ▼ 2.63% CSAN3 3.22 ▼ 1.83% RAIZ4 0.25 — 0.00% PCAR3 2.75 ▼ 0.36% GMAT3 3.65 ▼ 1.08% PSSA3 48.13 ▼ 0.54% CVCB3 1.33 ▼ 2.92% POSI3 3.36 ▲ 2.44% SLCE3 13.34 ▲ 0.30% NATU3 8.14 ▼ 0.73%
since 2009
Wednesday, October 7, 2026

Agri Business Business - Brazil

U.S. Crop Yields Soar, Pushing Grain Prices to Multi-Year Lows

By · September 24, 2024 · 2 min read

The September Harvest Moon signals a pivotal moment for farmers and grain markets alike. U.S. farmers are ramping up their harvest efforts, particularly for corn and soybeans.

The USDA‘s latest World Agricultural Supply and Demand report predicts a bumper crop year with record-breaking yields per acre for both major crops.

This abundant harvest is expected to result in substantial U.S. grain stockpiles, a scenario unseen in recent years. Grain prices have already plummeted to multi-year lows, hovering near production costs for corn and soybeans.

These price drops may create investment opportunities as the harvest progresses and stocks increase. Corn futures are currently trading around $4.00 per bushel, near the lower end of its 17-year trading range.

The influx of newly harvested stocks could potentially push corn prices to historic lows. Soybean markets are equally intriguing, with futures trading around $10.00 per bushel.
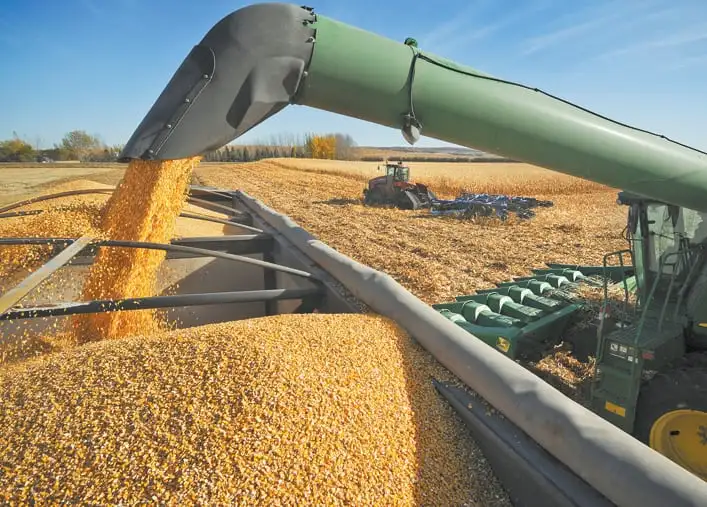
U.S. Crop Yields Soar, Pushing Grain Prices to Multi-Year Lows
U.S. Crop Yields Soar, Pushing Grain Prices to Multi-Year Lows.
RT
Ask Rio Times
Latin American markets, currencies and companies.
Open the full Ask Rio Times →

A record U.S. soybean harvest is anticipated this year, following Brazil’s bumper crop last season. This global abundance may continue to pressure U.S. soybean prices, potentially driving them below $8.00 per bushel.

The LatAm Brief

One email, every weekday morning. What moved in Latin American markets, politics and expat life.

Yesterday’s subject line: “Mexico sells record US$60.6bn to the US in August”

Free. We send a confirmation link first — nothing arrives until you click it. Unsubscribe with one click in any edition. If you stop opening us for 30 days we stop sending by ourselves, as we assume the interest is no longer there. See our privacy policy. We never share your email.

Wheat Market Uncertainty

Wheat prices, however, remain elevated due to uncertainties surrounding the Russia-Ukraine conflict. The world has consumed more wheat than it has produced for five consecutive years.

While global wheat stocks are currently adequate, any disruption could impact future prices. As a result, wheat prices have remained higher than usual, maintaining a wider-than-normal spread above corn prices.

Hedge funds, which have been bearish on grains for some time, are beginning to cover their short positions. As grain prices approach production costs, these funds recognize limited downside risk.

Historically, the risk-reward ratio at harvest lows tends to favor upward price movements. The September Harvest Moon marks a critical period for investors.

Over the next 4-6 weeks, as the Northern Hemisphere harvest continues, investors should watch for potential opportunities as grain prices may test their 17-year historical lows.

This lunar event, accompanied by a partial eclipse in some areas, signifies a turning point in both the harvest year and investment cycle.

While farmers busy themselves with their annual harvest, investors should closely monitor grain markets for possible new price lows between now and October’s Hunter’s Moon.

This article was produced by The Rio Times’ automated newsroom system. How we use AI · Report an error · Editorial responsibility: Matthias Camenzind, Editor-in-Chief

The Rio Times · Power Map
See who really holds power in Latin America
Click to open the Power Map →

Rotate for Best Experience

This report is optimized for landscape viewing. Rotate your phone for the full experience.