IBOV 183,827.59 ▲ 0.46% IPSA 11,055.91 ▼ 0.73% IPC MEX 65,071.30 ▲ 0.20% MERVAL 2,782,561 ▼ 0.59% COLCAP 2,558.92 ▼ 0.79% BVL PERÚ 60,220.45 ▲ 0.32% USD/BRL5.20▼ 0.43% USD/MXN18.07▲ 0.15% USD/CLP972.08▲ 0.38% USD/COP3,323▲ 0.62% USD/PEN3.44— 0.00% USD/ARS1,524▼ 0.05% USD/UYU40.27▲ 3.67% USD/PYG5,843▲ 2.30% USD/BOB11.96▲ 0.45% USD/DOP59.27▲ 2.75% USD/CRC452.68▲ 2.68% USD/GTQ7.64▲ 3.13% USD/HNL26.87▲ 3.23% USD/NIO36.62▲ 0.34% USD/VES856.92▲ 0.01% USD/PAB1.00— 0.00% USD/BZD2.00— 0.00% USD/JMD 157.28 — 0.00% USD/TTD6.70▲ 1.64% EUR/BRL5.90▲ 0.01% BRENT 88.88 ▼ 0.03% WTI 83.11 ▼ 0.11% IRON ORE 161.91 — — COPPER 6.61 ▲ 0.03% GOLD 4,461 ▲ 1.78% SILVER 65.59 ▲ 1.26% SOY 1,184 ▲ 3.20% CORN 480.50 ▲ 10.02% WHEAT 655.00 ▲ 3.93% COFFEE 317.25 ▼ 5.51% SUGAR 16.43 ▼ 1.79% ORANGE JUICE 138.55 ▼ 0.47% COTTON 85.03 ▲ 2.33% COCOA 5,719 ▲ 3.18% BEEF 223.60 ▼ 3.93% CATTLE 339.10 ▼ 3.16% LITHIUM 75.20 ▲ 1.47% PETR4 41.64 ▼ 0.05% VALE3 72.97 ▲ 0.83% ITUB4 38.60 ▼ 1.03% BBDC4 16.85 ▲ 0.36% ABEV3 14.89 ▼ 0.80% BBAS3 19.37 ▲ 0.47% B3SA3 14.26 ▼ 0.21% WEGE3 47.59 ▲ 0.49% PRIO3 59.14 ▼ 0.19% SUZB3 41.33 ▲ 2.35% RENT3 34.68 ▼ 0.09% AZZA3 15.89 ▼ 2.63% CSAN3 3.22 ▼ 1.83% RAIZ4 0.25 — 0.00% PCAR3 2.75 ▼ 0.36% GMAT3 3.65 ▼ 1.08% PSSA3 48.13 ▼ 0.54% CVCB3 1.33 ▼ 2.92% POSI3 3.36 ▲ 2.44% SLCE3 13.34 ▲ 0.30% NATU3 8.14 ▼ 0.73% IBOV 183,827.59 ▲ 0.46% IPSA 11,055.91 ▼ 0.73% IPC MEX 65,071.30 ▲ 0.20% MERVAL 2,782,561 ▼ 0.59% COLCAP 2,558.92 ▼ 0.79% BVL PERÚ 60,220.45 ▲ 0.32% USD/BRL 5.16 ▲ 0.01% USD/MXN 17.06 ▼ 0.24% USD/CLP 913.98 ▲ 0.04% USD/COP 3,140 ▲ 0.03% USD/PEN 3.36 ▼ 0.66% USD/ARS 1,493 ▲ 0.10% USD/UYU 40.27 ▲ 1.24% USD/PYG 5,939 ▲ 1.68% USD/BOB 11.64 ▼ 0.76% USD/DOP 58.34 ▲ 1.25% USD/CRC 445.92 ▲ 0.89% USD/GTQ 7.62 ▲ 2.21% USD/HNL 26.79 ▲ 1.57% USD/NIO 36.62 ▲ 0.69% USD/VES 762.44 ▼ 0.13% USD/PAB 1.00 — 0.00% USD/BZD 2.00 — 0.00% USD/JMD 157.28 — 0.00% USD/TTD 6.70 ▲ 0.61% EUR/BRL 5.95 ▲ 1.01% BRENT 88.88 ▼ 0.03% WTI 83.11 ▼ 0.11% IRON ORE 161.91 — — COPPER 6.61 ▲ 0.03% GOLD 4,461 ▲ 1.78% SILVER 65.59 ▲ 1.26% SOY 1,184 ▲ 3.20% CORN 480.50 ▲ 10.02% WHEAT 655.00 ▲ 3.93% COFFEE 317.25 ▼ 5.51% SUGAR 16.43 ▼ 1.79% ORANGE JUICE 138.55 ▼ 0.47% COTTON 85.03 ▲ 2.33% COCOA 5,719 ▲ 3.18% BEEF 223.60 ▼ 3.93% CATTLE 339.10 ▼ 3.16% LITHIUM 75.20 ▲ 1.47% PETR4 41.64 ▼ 0.05% VALE3 72.97 ▲ 0.83% ITUB4 38.60 ▼ 1.03% BBDC4 16.85 ▲ 0.36% ABEV3 14.89 ▼ 0.80% BBAS3 19.37 ▲ 0.47% B3SA3 14.26 ▼ 0.21% WEGE3 47.59 ▲ 0.49% PRIO3 59.14 ▼ 0.19% SUZB3 41.33 ▲ 2.35% RENT3 34.68 ▼ 0.09% AZZA3 15.89 ▼ 2.63% CSAN3 3.22 ▼ 1.83% RAIZ4 0.25 — 0.00% PCAR3 2.75 ▼ 0.36% GMAT3 3.65 ▼ 1.08% PSSA3 48.13 ▼ 0.54% CVCB3 1.33 ▼ 2.92% POSI3 3.36 ▲ 2.44% SLCE3 13.34 ▲ 0.30% NATU3 8.14 ▼ 0.73%
since 2009
Wednesday, September 30, 2026

Informal Work Dynamics in Brazilian States

By · December 3, 2023 · 2 min read

The LatAm Brief

One email, every weekday morning. What moved in Latin American markets, politics and expat life.

Yesterday’s subject line: “Argentina gives Britain two weeks over Falklands oil”

Free. We send a confirmation link first — nothing arrives until you click it. Unsubscribe with one click in any edition. If you stop opening us for 30 days we stop sending by ourselves, as we assume the interest is no longer there. See our privacy policy. We never share your email.

In the third quarter of 2023, Brazil witnessed 39 million of its workers in informal employment, making up 39.1% of its employed population.

This data from the Brazilian stats agency IBGE indicates a slight decrease in informal employment from the second quarter of the year, where it stood at 39.2%.

These figures nearly match the historical peak of the second quarter of 2022, when 40 million, or 39.3% of the employed, were in informal jobs.

Free daily brief — no card needed
Get every Latest News story in one morning email
We build you a personalized brief around the topics you follow — free for 7 days. Love it? Your first month after that is US$1.

The lowest incidence of informal employment was during the pandemic in the second quarter of 2020.

At that time, the informal sector accounted for 30.7% of the workforce, totaling 36.5 million people.

This fluctuation highlights the impact of economic and social changes on employment patterns.

Regionally, Maranhão leads with the highest informal employment rate at 57.3%. Following closely are Pará at 57.1%, Amazonas at 55%, and Piauí at 55%.
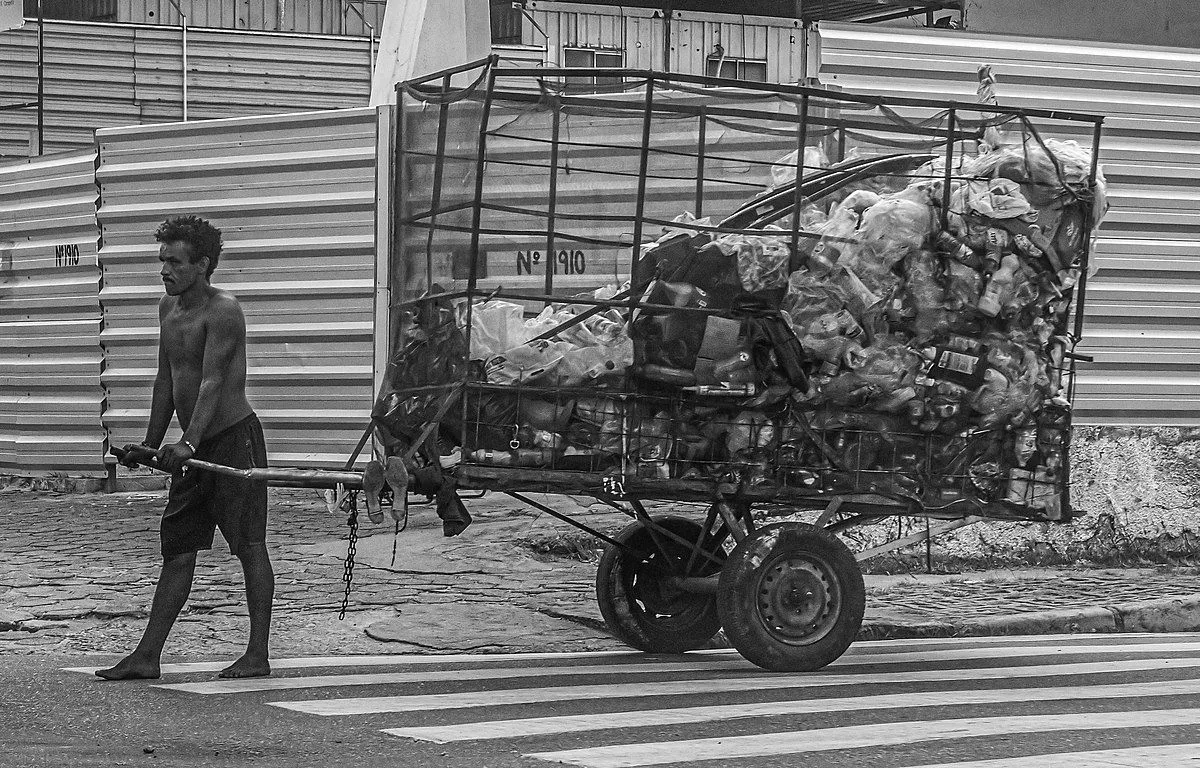
Informal Work Dynamics in Brazilian States.
One-stop reference
Company Intelligence
Every listed company in Latin America — financials, ownership and structure for 1,450+ companies across 26 exchanges, in one place.
Browse the directory →
RT
Ask Rio Times
17 years of Latin America reporting, on demand.
Open the full Ask Rio Times →

On the other end, Santa Catarina reports the lowest rate of informal work at 26.8%. These statistics shed light on the varied economic landscapes across Brazilian states.

They also underscore the challenges and dynamics within Brazil’s labor market, reflecting broader trends in the national economy.

Background

Comparatively, Brazil’s informal employment rate is higher than in many other countries.

This reflects unique socio-economic factors, including labor market flexibility and the prevalence of small-scale enterprises.

The high rate of informality often correlates with challenges in social security and labor rights.

Brazil’s regional variation in informal employment rates mirrors the country’s diverse economic conditions.

States like Maranhão and Pará, with higher informality, often have fewer industrial or formal job opportunities.

In contrast, states like Santa Catarina benefit from more diversified economies with greater formal employment.


This article was produced by The Rio Times’ automated newsroom system. How we use AI · Report an error

Read More from The Rio Times

The Rio Times · Power Map
See who really holds power in Latin America
Click to open the Power Map →

Rotate for Best Experience

This report is optimized for landscape viewing. Rotate your phone for the full experience.