IBOV 187,422.92 ▲ 0.44% IPSA 11,426.83 ▲ 0.61% IPC MEX 64,456.59 ▲ 1.45% MERVAL 2,997,659 ▼ 0.04% COLCAP 2,588.64 ▲ 0.90% BVL PERÚ 59,529.36 ▲ 1.84% USD/BRL5.11▲ 0.14% USD/MXN17.38▲ 0.48% USD/CLP943.65▼ 0.59% USD/COP3,204— 0.00% USD/PEN3.38▲ 0.10% USD/ARS1,514▼ 0.02% USD/UYU40.06▲ 2.88% USD/PYG5,918▲ 3.14% USD/BOB11.85▲ 25.24% USD/DOP59.28▲ 0.82% USD/CRC445.27▲ 2.84% USD/GTQ7.63▲ 3.24% USD/HNL26.86▲ 3.32% USD/NIO36.62▲ 2.68% USD/VES851.37— 0.00% USD/PAB1.00— 0.00% USD/BZD2.00— 0.00% USD/JMD 157.28 — 0.00% USD/TTD6.74▲ 2.48% EUR/BRL5.83▼ 0.45% BRENT 88.88 ▼ 0.03% WTI 83.11 ▼ 0.11% IRON ORE 161.91 — — COPPER 6.61 ▲ 0.03% GOLD 4,461 ▲ 1.78% SILVER 65.59 ▲ 1.26% SOY 1,184 ▲ 3.20% CORN 480.50 ▲ 10.02% WHEAT 655.00 ▲ 3.93% COFFEE 317.25 ▼ 5.51% SUGAR 16.43 ▼ 1.79% ORANGE JUICE 138.55 ▼ 0.47% COTTON 85.03 ▲ 2.33% COCOA 5,719 ▲ 3.18% BEEF 223.60 ▼ 3.93% CATTLE 339.10 ▼ 3.16% LITHIUM 75.20 ▲ 1.47% PETR4 41.64 ▼ 0.05% VALE3 72.97 ▲ 0.83% ITUB4 38.60 ▼ 1.03% BBDC4 16.85 ▲ 0.36% ABEV3 14.89 ▼ 0.80% BBAS3 19.37 ▲ 0.47% B3SA3 14.26 ▼ 0.21% WEGE3 47.59 ▲ 0.49% PRIO3 59.14 ▼ 0.19% SUZB3 41.33 ▲ 2.35% RENT3 34.68 ▼ 0.09% AZZA3 15.89 ▼ 2.63% CSAN3 3.22 ▼ 1.83% RAIZ4 0.25 — 0.00% PCAR3 2.75 ▼ 0.36% GMAT3 3.65 ▼ 1.08% PSSA3 48.13 ▼ 0.54% CVCB3 1.33 ▼ 2.92% POSI3 3.36 ▲ 2.44% SLCE3 13.34 ▲ 0.30% NATU3 8.14 ▼ 0.73% IBOV 187,422.92 ▲ 0.44% IPSA 11,426.83 ▲ 0.61% IPC MEX 64,456.59 ▲ 1.45% MERVAL 2,997,659 ▼ 0.04% COLCAP 2,588.64 ▲ 0.90% BVL PERÚ 59,529.36 ▲ 1.84% USD/BRL 5.16 ▲ 0.01% USD/MXN 17.06 ▼ 0.24% USD/CLP 913.98 ▲ 0.04% USD/COP 3,140 ▲ 0.03% USD/PEN 3.36 ▼ 0.66% USD/ARS 1,493 ▲ 0.10% USD/UYU 40.27 ▲ 1.24% USD/PYG 5,939 ▲ 1.68% USD/BOB 11.64 ▼ 0.76% USD/DOP 58.34 ▲ 1.25% USD/CRC 445.92 ▲ 0.89% USD/GTQ 7.62 ▲ 2.21% USD/HNL 26.79 ▲ 1.57% USD/NIO 36.62 ▲ 0.69% USD/VES 762.44 ▼ 0.13% USD/PAB 1.00 — 0.00% USD/BZD 2.00 — 0.00% USD/JMD 157.28 — 0.00% USD/TTD 6.70 ▲ 0.61% EUR/BRL 5.95 ▲ 1.01% BRENT 88.88 ▼ 0.03% WTI 83.11 ▼ 0.11% IRON ORE 161.91 — — COPPER 6.61 ▲ 0.03% GOLD 4,461 ▲ 1.78% SILVER 65.59 ▲ 1.26% SOY 1,184 ▲ 3.20% CORN 480.50 ▲ 10.02% WHEAT 655.00 ▲ 3.93% COFFEE 317.25 ▼ 5.51% SUGAR 16.43 ▼ 1.79% ORANGE JUICE 138.55 ▼ 0.47% COTTON 85.03 ▲ 2.33% COCOA 5,719 ▲ 3.18% BEEF 223.60 ▼ 3.93% CATTLE 339.10 ▼ 3.16% LITHIUM 75.20 ▲ 1.47% PETR4 41.64 ▼ 0.05% VALE3 72.97 ▲ 0.83% ITUB4 38.60 ▼ 1.03% BBDC4 16.85 ▲ 0.36% ABEV3 14.89 ▼ 0.80% BBAS3 19.37 ▲ 0.47% B3SA3 14.26 ▼ 0.21% WEGE3 47.59 ▲ 0.49% PRIO3 59.14 ▼ 0.19% SUZB3 41.33 ▲ 2.35% RENT3 34.68 ▼ 0.09% AZZA3 15.89 ▼ 2.63% CSAN3 3.22 ▼ 1.83% RAIZ4 0.25 — 0.00% PCAR3 2.75 ▼ 0.36% GMAT3 3.65 ▼ 1.08% PSSA3 48.13 ▼ 0.54% CVCB3 1.33 ▼ 2.92% POSI3 3.36 ▲ 2.44% SLCE3 13.34 ▲ 0.30% NATU3 8.14 ▼ 0.73%
since 2009
Wednesday, September 23, 2026

Brazil Business - Brazil

Braskem Reports $940 Million Loss in Q4 Amid Falling Spreads and Rising Debt

By · February 28, 2025 · 2 min read

The LatAm Brief

One email, every weekday morning. What moved in Latin American markets, politics and expat life.

Yesterday’s subject line: “A Category 5 hurricane has stopped moving off Mexico”

Free. We send a confirmation link first — nothing arrives until you click it. Unsubscribe with one click in any edition. If you stop opening us for 30 days we stop sending by ourselves, as we assume the interest is no longer there. See our privacy policy. We never share your email.

Braskem, Latin America’s largest petrochemical company, closed 2024 with a staggering R$5.65 billion ($940 million) net loss in the fourth quarter.

This marked a 259% increase compared to the same period in 2023, as revealed in its financial report on February 27. For the full year, losses totaled R$11.32 billion ($1.89 billion), up 147% from 2023, reflecting significant challenges across global markets.

The company’s recurring EBITDA fell to R$557 million ($93 million) in Q4, down 47% year-over-year. Analysts expected stronger results, but weak petrochemical spreads and declining demand weighed heavily on performance.

Braskem’s net revenue grew 15% to R$19.15 billion ($3.19 billion), driven by higher sales prices in some segments, but this failed to offset operational pressures. Petrochemical spreads dropped sharply, with polyethylene-naphtha spreads in Brazil falling 23% and basic chemical spreads declining 24%.

In Mexico, polyethylene spreads fell 21%, driven by rising ethane costs and weaker pricing. Demand for resins in Brazil hit its lowest level of the year due to high interest rates and sluggish industrial activity.
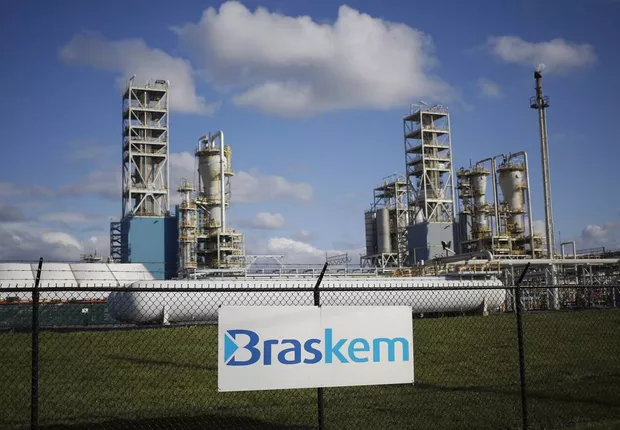
Braskem Reports $940 Million Loss in Q4 Amid Falling Spreads and Rising Debt
Braskem Reports $940 Million Loss in Q4 Amid Falling Spreads and Rising Debt.
RT
Ask Rio Times
Latin American markets, currencies and companies.
Open the full Ask Rio Times →

U.S. and European markets also struggled with economic uncertainty, further pressuring sales volumes. Braskem faced additional challenges from higher environmental provisions and idle capacity costs.

Braskem Faces Increased Debt & Market Volatility

The company’s net debt rose by $338 million during the quarter to $6.1 billion, pushing its leverage ratio to 7.4 times net debt-to-EBITDA, up from 6.1 times in the prior quarter.

Market reactions reflected investor concerns, with Braskem shares (BRKM5) falling 2.15% to R$11.81 ($1.97) on February 27 after hitting an intraday low of R$11.14 ($1.86).

Analysts at XP Investimentos noted that recurring EBITDA was 68% below expectations, while Bradesco BBI highlighted a disappointing performance despite some improvement in free cash flow generation.

While Braskem implemented cost-cutting measures and maintained a robust $2.4 billion cash position, recovery depends on improved global demand and petrochemical spreads.

Bradesco BBI maintained an “outperform” rating for Braskem’s U.S.-listed shares with a price target of $8.50 but warned that market conditions must improve for sustained recovery.

Live Company IntelligenceBraskem S.A — the full investor dossierInside: live share price, market cap, three-year financials, valuation, ESG and peer benchmarks — plus the latest Rio Times coverage.
B
◆ Live Company Intelligence
Braskem
SA: BRKM5BRKM5Basic MaterialsChemicals8,233 employees
R$3.55B
Market cap

Valuation & profitability

Market capR$3.55B
Revenue (TTM)R$70.60B
Profit margin-7.9%
Return on equity-548.8%

Price & risk

52-wk low
$3.52
52-wk high
$13.78
Beta (volatility)0.68
200-day average$8.26

Revenue trend · 6y

20202025
Latest R$70.72B

Ownership

Institutions14.2%
Shares outstanding345M

Dividend

No regular dividend — earnings reinvested for growth.
What Braskem does. Braskem S.A., together with its subsidiaries, engages in the manufacture, sale, import, and export of chemicals, petrochemicals, and fuels in Brazil. The company supplies electricity and other inputs to second-generation producers; sells utilities, such as steam, water, compressed air and industrial gases; industrial services; and engages in the production, supply, and sale…
Data: RT fundamentals (BRKM5.SA) · figures in BRL · as of 23 Sep 2026More company intelligence →

This article was produced by The Rio Times’ automated newsroom system. How we use AI · Report an error

LatAm Markets: Live Signals → — real-time movers, turnover leaders and FX across Latin America.

Read More from The Rio Times

The Rio Times · Power Map
See who really holds power in Latin America
Click to open the Power Map

Rotate for Best Experience

This report is optimized for landscape viewing. Rotate your phone for the full experience.