IBOV 206,911.89 ▲ 7.70% IPSA 11,124.65 ▲ 1.91% IPC MEX 64,975.08 ▲ 0.69% MERVAL 2,869,488 — 0.00% COLCAP 2,582.65 ▲ 2.69% BVL PERÚ 59,860.04 ▲ 0.60% USD/BRL4.99▼ 0.04% USD/MXN18.04▼ 0.20% USD/CLP970.78▼ 0.19% USD/COP3,197▲ 0.11% USD/PEN3.44▼ 0.26% USD/ARS1,520▼ 0.32% USD/UYU40.34▼ 0.30% USD/PYG5,844▲ 0.40% USD/BOB11.95▲ 0.17% USD/DOP60.10▲ 0.33% USD/CRC455.71▼ 0.15% USD/GTQ7.63▼ 0.09% USD/HNL26.86▼ 0.01% USD/NIO36.62▲ 2.96% USD/VES870.21▼ 0.01% USD/PAB1.00— 0.00% USD/BZD2.00— 0.00% USD/JMD 157.28 — 0.00% USD/TTD6.68▼ 0.14% EUR/BRL5.62▼ 4.27% BRENT 88.88 ▼ 0.03% WTI 83.11 ▼ 0.11% IRON ORE 161.91 — — COPPER 6.61 ▲ 0.03% GOLD 4,461 ▲ 1.78% SILVER 65.59 ▲ 1.26% SOY 1,184 ▲ 3.20% CORN 480.50 ▲ 10.02% WHEAT 655.00 ▲ 3.93% COFFEE 317.25 ▼ 5.51% SUGAR 16.43 ▼ 1.79% ORANGE JUICE 138.55 ▼ 0.47% COTTON 85.03 ▲ 2.33% COCOA 5,719 ▲ 3.18% BEEF 223.60 ▼ 3.93% CATTLE 339.10 ▼ 3.16% LITHIUM 75.20 ▲ 1.47% PETR4 41.64 ▼ 0.05% VALE3 72.97 ▲ 0.83% ITUB4 38.60 ▼ 1.03% BBDC4 16.85 ▲ 0.36% ABEV3 14.89 ▼ 0.80% BBAS3 19.37 ▲ 0.47% B3SA3 14.26 ▼ 0.21% WEGE3 47.59 ▲ 0.49% PRIO3 59.14 ▼ 0.19% SUZB3 41.33 ▲ 2.35% RENT3 34.68 ▼ 0.09% AZZA3 15.89 ▼ 2.63% CSAN3 3.22 ▼ 1.83% RAIZ4 0.25 — 0.00% PCAR3 2.75 ▼ 0.36% GMAT3 3.65 ▼ 1.08% PSSA3 48.13 ▼ 0.54% CVCB3 1.33 ▼ 2.92% POSI3 3.36 ▲ 2.44% SLCE3 13.34 ▲ 0.30% NATU3 8.14 ▼ 0.73% IBOV 206,911.89 ▲ 7.70% IPSA 11,124.65 ▲ 1.91% IPC MEX 64,975.08 ▲ 0.69% MERVAL 2,869,488 — 0.00% COLCAP 2,582.65 ▲ 2.69% BVL PERÚ 59,860.04 ▲ 0.60% USD/BRL 5.16 ▲ 0.01% USD/MXN 17.06 ▼ 0.24% USD/CLP 913.98 ▲ 0.04% USD/COP 3,140 ▲ 0.03% USD/PEN 3.36 ▼ 0.66% USD/ARS 1,493 ▲ 0.10% USD/UYU 40.27 ▲ 1.24% USD/PYG 5,939 ▲ 1.68% USD/BOB 11.64 ▼ 0.76% USD/DOP 58.34 ▲ 1.25% USD/CRC 445.92 ▲ 0.89% USD/GTQ 7.62 ▲ 2.21% USD/HNL 26.79 ▲ 1.57% USD/NIO 36.62 ▲ 0.69% USD/VES 762.44 ▼ 0.13% USD/PAB 1.00 — 0.00% USD/BZD 2.00 — 0.00% USD/JMD 157.28 — 0.00% USD/TTD 6.70 ▲ 0.61% EUR/BRL 5.95 ▲ 1.01% BRENT 88.88 ▼ 0.03% WTI 83.11 ▼ 0.11% IRON ORE 161.91 — — COPPER 6.61 ▲ 0.03% GOLD 4,461 ▲ 1.78% SILVER 65.59 ▲ 1.26% SOY 1,184 ▲ 3.20% CORN 480.50 ▲ 10.02% WHEAT 655.00 ▲ 3.93% COFFEE 317.25 ▼ 5.51% SUGAR 16.43 ▼ 1.79% ORANGE JUICE 138.55 ▼ 0.47% COTTON 85.03 ▲ 2.33% COCOA 5,719 ▲ 3.18% BEEF 223.60 ▼ 3.93% CATTLE 339.10 ▼ 3.16% LITHIUM 75.20 ▲ 1.47% PETR4 41.64 ▼ 0.05% VALE3 72.97 ▲ 0.83% ITUB4 38.60 ▼ 1.03% BBDC4 16.85 ▲ 0.36% ABEV3 14.89 ▼ 0.80% BBAS3 19.37 ▲ 0.47% B3SA3 14.26 ▼ 0.21% WEGE3 47.59 ▲ 0.49% PRIO3 59.14 ▼ 0.19% SUZB3 41.33 ▲ 2.35% RENT3 34.68 ▼ 0.09% AZZA3 15.89 ▼ 2.63% CSAN3 3.22 ▼ 1.83% RAIZ4 0.25 — 0.00% PCAR3 2.75 ▼ 0.36% GMAT3 3.65 ▼ 1.08% PSSA3 48.13 ▼ 0.54% CVCB3 1.33 ▼ 2.92% POSI3 3.36 ▲ 2.44% SLCE3 13.34 ▲ 0.30% NATU3 8.14 ▼ 0.73%
since 2009
Tuesday, October 6, 2026

Brazil Life & Society

Renewables Lead Brazil’s Largest Energy Matrix Expansion Since 1997

By · January 13, 2025 · 2 min read

Brazil’s National Electric Energy Agency (Aneel) reported a record-breaking expansion of the country’s energy matrix in 2024. The South American nation added 10,853.35 megawatts (MW) of new capacity, surpassing the agency’s target by 747.35 MW.

This remarkable growth marks the largest annual increase since measurements began in 1997. The energy sector witnessed the inauguration of 301 new power plants across 16 Brazilian states. Renewable sources dominated the expansion, with solar and wind energy accounting for 91.13% of the newly installed capacity.

Solar photovoltaic plants led the charge, contributing 51.87% of the new power. Wind energy followed closely, providing 39.26% of the additional capacity. This shift towards clean energy sources aligns with global efforts to combat climate change.

The breakdown of new installations showcases Brazil’s diverse energy portfolio. The country added 147 solar photovoltaic plants, generating 5,629.69 MW. Wind energy saw 121 new facilities, producing 4,260.57 MW. Thermoelectric plants, small hydroelectric centers, and hydroelectric generating stations rounded out the expansion.
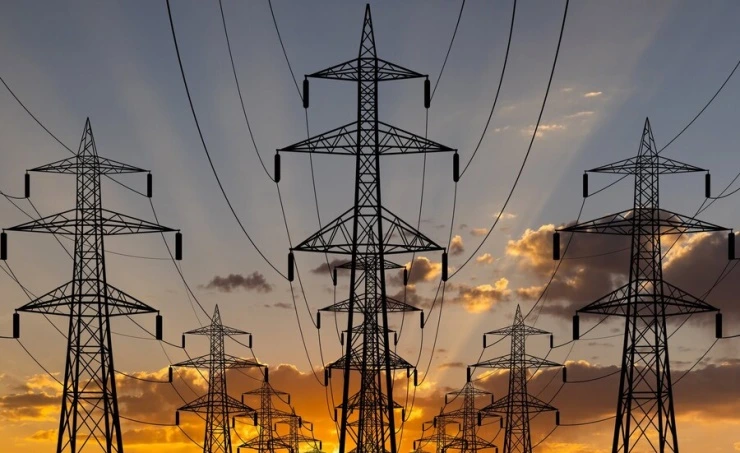
Renewables Lead Brazil's Largest Energy Matrix Expansion Since 1997.
Renewables Lead Brazil’s Largest Energy Matrix Expansion Since 1997.
RT
Ask Rio Times
This story and the bigger picture.
Open the full Ask Rio Times →

December 2024 alone saw an increase of 502.59 MW, spread across 16 new plants. This final push included nine solar facilities, five wind plants, one thermoelectric station, and a small hydroelectric center.

The LatAm Brief

One email, every weekday morning. What moved in Latin American markets, politics and expat life.

Yesterday’s subject line: “Brazil stocks jump 7.7%, real up 4%, after the vote”

Free. We send a confirmation link first — nothing arrives until you click it. Unsubscribe with one click in any edition. If you stop opening us for 30 days we stop sending by ourselves, as we assume the interest is no longer there. See our privacy policy. We never share your email.

Renewables Lead Brazil’s Largest Energy Matrix Expansion Since 1997

Brazil’s impressive energy growth reflects its commitment to sustainable development. The country’s focus on renewable sources not only boosts its energy independence but also positions it as a leader in green energy production. This expansion promises to support economic growth while minimizing environmental impact.

However, it’s worth noting that Brazil’s energy strategy diverges from some global trends. While tech giants and data center operators in other countries are exploring nuclear options to power AI and data centers, Brazil’s expansion notably lacks nuclear projects. This absence is significant given the challenges facing nuclear power deployment worldwide.

Nuclear projects typically face long development timelines, high costs, and safety concerns. The levelized cost of electricity for nuclear plants often exceeds that of wind and solar power. Additionally, the inflexibility of nuclear power can hinder the integration of

This article was drafted with automated assistance and reviewed before publication. How we use AI · Report an error · Editorial responsibility: Matthias Camenzind, Editor-in-Chief

The Rio Times · Power Map
See who really holds power in Latin America
Click to open the Power Map →

Rotate for Best Experience

This report is optimized for landscape viewing. Rotate your phone for the full experience.