IBOV 183,150.19 ▲ 1.91% IPSA 11,315.26 ▼ 1.14% IPC MEX 64,514.25 ▼ 1.40% MERVAL 3,057,915 ▲ 0.28% COLCAP 2,483.01 ▲ 0.52% BVL PERÚ 59,515.48 ▲ 0.86% USD/BRL5.11▼ 0.89% USD/MXN16.99▼ 0.05% USD/CLP936.26▼ 0.12% USD/COP3,136▼ 2.27% USD/PEN3.35▼ 0.30% USD/ARS1,512▼ 0.05% USD/UYU40.24▲ 1.21% USD/PYG5,885▲ 1.38% USD/BOB12.20▲ 4.46% USD/DOP58.55▲ 0.49% USD/CRC445.58▲ 1.89% USD/GTQ7.63▲ 2.07% USD/HNL26.83▲ 1.45% USD/NIO36.62▲ 0.20% USD/VES799.17▼ 0.13% USD/PAB1.00— 0.00% USD/BZD2.00— 0.00% USD/JMD 157.28 — 0.00% USD/TTD6.66▲ 0.93% EUR/BRL5.92▼ 1.53% BRENT 88.88 ▼ 0.03% WTI 83.11 ▼ 0.11% IRON ORE 161.91 — — COPPER 6.61 ▲ 0.03% GOLD 4,461 ▲ 1.78% SILVER 65.59 ▲ 1.26% SOY 1,184 ▲ 3.20% CORN 480.50 ▲ 10.02% WHEAT 655.00 ▲ 3.93% COFFEE 317.25 ▼ 5.51% SUGAR 16.43 ▼ 1.79% ORANGE JUICE 138.55 ▼ 0.47% COTTON 85.03 ▲ 2.33% COCOA 5,719 ▲ 3.18% BEEF 223.60 ▼ 3.93% CATTLE 339.10 ▼ 3.16% LITHIUM 75.20 ▲ 1.47% PETR4 41.64 ▼ 0.05% VALE3 72.97 ▲ 0.83% ITUB4 38.60 ▼ 1.03% BBDC4 16.85 ▲ 0.36% ABEV3 14.89 ▼ 0.80% BBAS3 19.37 ▲ 0.47% B3SA3 14.26 ▼ 0.21% WEGE3 47.59 ▲ 0.49% PRIO3 59.14 ▼ 0.19% SUZB3 41.33 ▲ 2.35% RENT3 34.68 ▼ 0.09% AZZA3 15.89 ▼ 2.63% CSAN3 3.22 ▼ 1.83% RAIZ4 0.25 — 0.00% PCAR3 2.75 ▼ 0.36% GMAT3 3.65 ▼ 1.08% PSSA3 48.13 ▼ 0.54% CVCB3 1.33 ▼ 2.92% POSI3 3.36 ▲ 2.44% SLCE3 13.34 ▲ 0.30% NATU3 8.14 ▼ 0.73% IBOV 183,150.19 ▲ 1.91% IPSA 11,315.26 ▼ 1.14% IPC MEX 64,514.25 ▼ 1.40% MERVAL 3,057,915 ▲ 0.28% COLCAP 2,483.01 ▲ 0.52% BVL PERÚ 59,515.48 ▲ 0.86% USD/BRL 5.16 ▲ 0.01% USD/MXN 17.06 ▼ 0.24% USD/CLP 913.98 ▲ 0.04% USD/COP 3,140 ▲ 0.03% USD/PEN 3.36 ▼ 0.66% USD/ARS 1,493 ▲ 0.10% USD/UYU 40.27 ▲ 1.24% USD/PYG 5,939 ▲ 1.68% USD/BOB 11.64 ▼ 0.76% USD/DOP 58.34 ▲ 1.25% USD/CRC 445.92 ▲ 0.89% USD/GTQ 7.62 ▲ 2.21% USD/HNL 26.79 ▲ 1.57% USD/NIO 36.62 ▲ 0.69% USD/VES 762.44 ▼ 0.13% USD/PAB 1.00 — 0.00% USD/BZD 2.00 — 0.00% USD/JMD 157.28 — 0.00% USD/TTD 6.70 ▲ 0.61% EUR/BRL 5.95 ▲ 1.01% BRENT 88.88 ▼ 0.03% WTI 83.11 ▼ 0.11% IRON ORE 161.91 — — COPPER 6.61 ▲ 0.03% GOLD 4,461 ▲ 1.78% SILVER 65.59 ▲ 1.26% SOY 1,184 ▲ 3.20% CORN 480.50 ▲ 10.02% WHEAT 655.00 ▲ 3.93% COFFEE 317.25 ▼ 5.51% SUGAR 16.43 ▼ 1.79% ORANGE JUICE 138.55 ▼ 0.47% COTTON 85.03 ▲ 2.33% COCOA 5,719 ▲ 3.18% BEEF 223.60 ▼ 3.93% CATTLE 339.10 ▼ 3.16% LITHIUM 75.20 ▲ 1.47% PETR4 41.64 ▼ 0.05% VALE3 72.97 ▲ 0.83% ITUB4 38.60 ▼ 1.03% BBDC4 16.85 ▲ 0.36% ABEV3 14.89 ▼ 0.80% BBAS3 19.37 ▲ 0.47% B3SA3 14.26 ▼ 0.21% WEGE3 47.59 ▲ 0.49% PRIO3 59.14 ▼ 0.19% SUZB3 41.33 ▲ 2.35% RENT3 34.68 ▼ 0.09% AZZA3 15.89 ▼ 2.63% CSAN3 3.22 ▼ 1.83% RAIZ4 0.25 — 0.00% PCAR3 2.75 ▼ 0.36% GMAT3 3.65 ▼ 1.08% PSSA3 48.13 ▼ 0.54% CVCB3 1.33 ▼ 2.92% POSI3 3.36 ▲ 2.44% SLCE3 13.34 ▲ 0.30% NATU3 8.14 ▼ 0.73%
since 2009
Wednesday, September 2, 2026

Agri Business Business - Brazil

Global Coffee Market Grows 4% in 2024 Amid Climate and Supply Challenges

By · March 5, 2025 · 2 min read

Daily Brief

The morning intel from across Latin America. Free.

By subscribing you agree to our privacy policy. We never share your email.

The U.S. Department of Agriculture (USDA) reported that global coffee production grew by 4% in 2024, reaching 10.5 million tonnes.

This increase was fueled by favorable weather conditions and advancements in agricultural practices, particularly in the “coffee belt,” a region near the equator responsible for 90% of global output.

However, the industry faced significant hurdles, including climate-related disruptions and supply chain issues, which shaped market dynamics and prices. Brazil and Vietnam continued to dominate global coffee production, contributing over 55% of the total supply.

Brazil retained its position as the largest producer, accounting for 38% of global output with approximately 3.98 million tonnes of arabica coffee. Vietnam followed with 17%, producing around 1.8 million tonnes, primarily robusta coffee known for its heat tolerance.

Other key producers included Colombia (7%), Indonesia (6%), Ethiopia (5%), and Uganda (4%), each offering unique coffee varieties that cater to diverse consumer preferences.
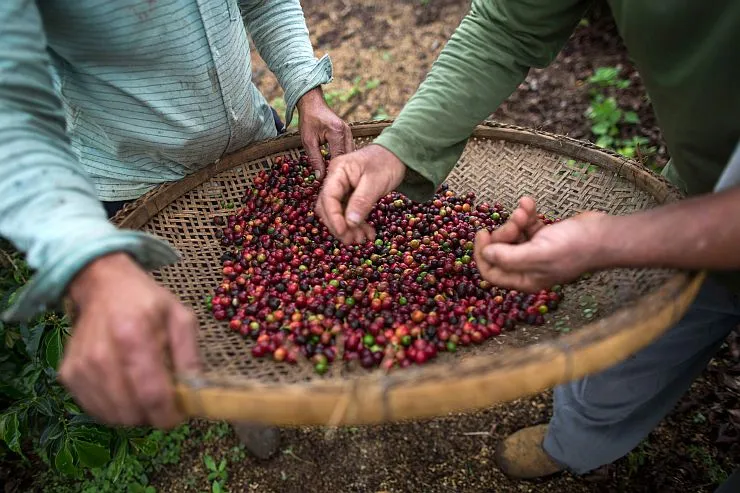
Global Coffee Market Grows 4% in 2024 Amid Climate and Supply Challenges
Global Coffee Market Grows 4% in 2024 Amid Climate and Supply Challenges. (Photo Internet reproduction)
One-stop reference
Company Intelligence
Every listed company in Latin America — financials, ownership and structure for 1,450+ companies across 26 exchanges, in one place.
Browse the directory →
RT
Ask Rio Times
Latin American markets, currencies and companies.
Open the full Ask Rio Times →

While production increased overall, extreme weather events caused localized disruptions. The El Niño phenomenon led to severe droughts in Brazil, reducing arabica yields by up to 12% during critical flowering periods.

Coffee Industry Faces Challenges

In Vietnam and Indonesia, water shortages similarly impacted robusta crops. These challenges pushed arabica coffee prices to $4 per pound, a sharp rise compared to earlier in the year.

Supply chain issues compounded these problems. Brazil’s export volumes fell by 2.6 million bags compared to the previous year due to logistical constraints and lower stockpiles. Global reserves dropped to their lowest levels since 2018, heightening concerns about future supply stability.

Despite these setbacks, technological advancements are reshaping the industry. AI-driven plantation monitoring systems are improving efficiency but remain inaccessible to smaller producers due to high costs, perpetuating inequalities in production capabilities.

Consumer preferences also evolved in 2024. Specialty coffees gained traction in Europe and North America, with organic varieties growing by 5% and 8%, respectively. Ready-to-drink products like cold brews surged in popularity, especially among younger consumers in the U.S. and China.

Looking ahead to 2025, coffee prices are expected to remain high due to ongoing climatic risks and economic pressures. The industry’s ability to adapt through sustainable practices and technology will be crucial in navigating these challenges while meeting growing global demand.

This article was produced by The Rio Times’ automated newsroom system. How we use AI · Report an error

Read More from The Rio Times

The Rio Times · Power Map
See who really holds power in Latin America
Click to open the Power Map

Rotate for Best Experience

This report is optimized for landscape viewing. Rotate your phone for the full experience.