IBOV 177,599.57 ▲ 1.10% IPSA 11,335.31 ▼ 0.97% IPC MEX 65,048.39 ▼ 0.67% MERVAL 3,052,917 ▲ 2.47% COLCAP 2,476.26 ▲ 0.75% BVL PERÚ 59,928.30 ▲ 0.07% USD/BRL5.18▼ 0.18% USD/MXN16.99▼ 0.25% USD/CLP934.80▲ 0.36% USD/COP3,218▲ 0.58% USD/PEN3.37▲ 0.46% USD/ARS1,509▼ 0.28% USD/UYU40.29▲ 0.05% USD/PYG5,892▼ 0.13% USD/BOB11.84▲ 0.51% USD/DOP58.64▲ 0.05% USD/CRC446.47▼ 0.04% USD/GTQ7.62▼ 0.02% USD/HNL26.84— 0.00% USD/NIO36.62— 0.00% USD/VES793.00▼ 0.13% USD/PAB1.00— 0.00% USD/BZD2.00— 0.00% USD/JMD 157.28 — 0.00% USD/TTD6.69▼ 0.37% EUR/BRL6.02▼ 0.10% BRENT 88.88 ▼ 0.03% WTI 83.11 ▼ 0.11% IRON ORE 161.91 — — COPPER 6.61 ▲ 0.03% GOLD 4,461 ▲ 1.78% SILVER 65.59 ▲ 1.26% SOY 1,184 ▲ 3.20% CORN 480.50 ▲ 10.02% WHEAT 655.00 ▲ 3.93% COFFEE 317.25 ▼ 5.51% SUGAR 16.43 ▼ 1.79% ORANGE JUICE 138.55 ▼ 0.47% COTTON 85.03 ▲ 2.33% COCOA 5,719 ▲ 3.18% BEEF 223.60 ▼ 3.93% CATTLE 339.10 ▼ 3.16% LITHIUM 75.20 ▲ 1.47% PETR4 41.64 ▼ 0.05% VALE3 72.97 ▲ 0.83% ITUB4 38.60 ▼ 1.03% BBDC4 16.85 ▲ 0.36% ABEV3 14.89 ▼ 0.80% BBAS3 19.37 ▲ 0.47% B3SA3 14.26 ▼ 0.21% WEGE3 47.59 ▲ 0.49% PRIO3 59.14 ▼ 0.19% SUZB3 41.33 ▲ 2.35% RENT3 34.68 ▼ 0.09% AZZA3 15.89 ▼ 2.63% CSAN3 3.22 ▼ 1.83% RAIZ4 0.25 — 0.00% PCAR3 2.75 ▼ 0.36% GMAT3 3.65 ▼ 1.08% PSSA3 48.13 ▼ 0.54% CVCB3 1.33 ▼ 2.92% POSI3 3.36 ▲ 2.44% SLCE3 13.34 ▲ 0.30% NATU3 8.14 ▼ 0.73% IBOV 177,599.57 ▲ 1.10% IPSA 11,335.31 ▼ 0.97% IPC MEX 65,048.39 ▼ 0.67% MERVAL 3,052,917 ▲ 2.47% COLCAP 2,476.26 ▲ 0.75% BVL PERÚ 59,928.30 ▲ 0.07% USD/BRL 5.16 ▲ 0.01% USD/MXN 17.06 ▼ 0.24% USD/CLP 913.98 ▲ 0.04% USD/COP 3,140 ▲ 0.03% USD/PEN 3.36 ▼ 0.66% USD/ARS 1,493 ▲ 0.10% USD/UYU 40.27 ▲ 1.24% USD/PYG 5,939 ▲ 1.68% USD/BOB 11.64 ▼ 0.76% USD/DOP 58.34 ▲ 1.25% USD/CRC 445.92 ▲ 0.89% USD/GTQ 7.62 ▲ 2.21% USD/HNL 26.79 ▲ 1.57% USD/NIO 36.62 ▲ 0.69% USD/VES 762.44 ▼ 0.13% USD/PAB 1.00 — 0.00% USD/BZD 2.00 — 0.00% USD/JMD 157.28 — 0.00% USD/TTD 6.70 ▲ 0.61% EUR/BRL 5.95 ▲ 1.01% BRENT 88.88 ▼ 0.03% WTI 83.11 ▼ 0.11% IRON ORE 161.91 — — COPPER 6.61 ▲ 0.03% GOLD 4,461 ▲ 1.78% SILVER 65.59 ▲ 1.26% SOY 1,184 ▲ 3.20% CORN 480.50 ▲ 10.02% WHEAT 655.00 ▲ 3.93% COFFEE 317.25 ▼ 5.51% SUGAR 16.43 ▼ 1.79% ORANGE JUICE 138.55 ▼ 0.47% COTTON 85.03 ▲ 2.33% COCOA 5,719 ▲ 3.18% BEEF 223.60 ▼ 3.93% CATTLE 339.10 ▼ 3.16% LITHIUM 75.20 ▲ 1.47% PETR4 41.64 ▼ 0.05% VALE3 72.97 ▲ 0.83% ITUB4 38.60 ▼ 1.03% BBDC4 16.85 ▲ 0.36% ABEV3 14.89 ▼ 0.80% BBAS3 19.37 ▲ 0.47% B3SA3 14.26 ▼ 0.21% WEGE3 47.59 ▲ 0.49% PRIO3 59.14 ▼ 0.19% SUZB3 41.33 ▲ 2.35% RENT3 34.68 ▼ 0.09% AZZA3 15.89 ▼ 2.63% CSAN3 3.22 ▼ 1.83% RAIZ4 0.25 — 0.00% PCAR3 2.75 ▼ 0.36% GMAT3 3.65 ▼ 1.08% PSSA3 48.13 ▼ 0.54% CVCB3 1.33 ▼ 2.92% POSI3 3.36 ▲ 2.44% SLCE3 13.34 ▲ 0.30% NATU3 8.14 ▼ 0.73%
since 2009
Monday, August 31, 2026

Latin America Colombia

Colombia’s Free-Trade Zones Send a Mixed Signal: Exports Down 21% as Imports Rise

By · October 21, 2025 · 2 min read

Daily Brief

The morning intel from across Latin America. Free.

By subscribing you agree to our privacy policy. We never share your email.

Colombia’s policy-favored industrial parks—its free-trade zones—flashed a warning in August. They shipped fewer goods abroad even as they brought in more parts and equipment, a split that hints at softer orders overseas and factories keeping production lines ready.

Exports from the zones fell to $216.4 million in August 2025, a 21.2% year-on-year drop from $274.6 million. Imports moved the other way, rising 20.6% to $196.2 million.

The steepest damage came from the single-company “Special Permanent” zones, where exports slumped 40.2%. Multi-user parks dipped just 1.2%.

Geography mattered too: Palmaseca (by Cali’s international airport) and Cencauca (Parque Industrial Caloto, Cauca) were major drags, while Rionegro (serving Medellín’s main airport) and Internacional de Pereira partly offset the decline.

The story behind the story is one of pipeline stress. These zones sit next to airports and arterial roads and operate under tax and customs incentives to assemble, process, and re-export goods.
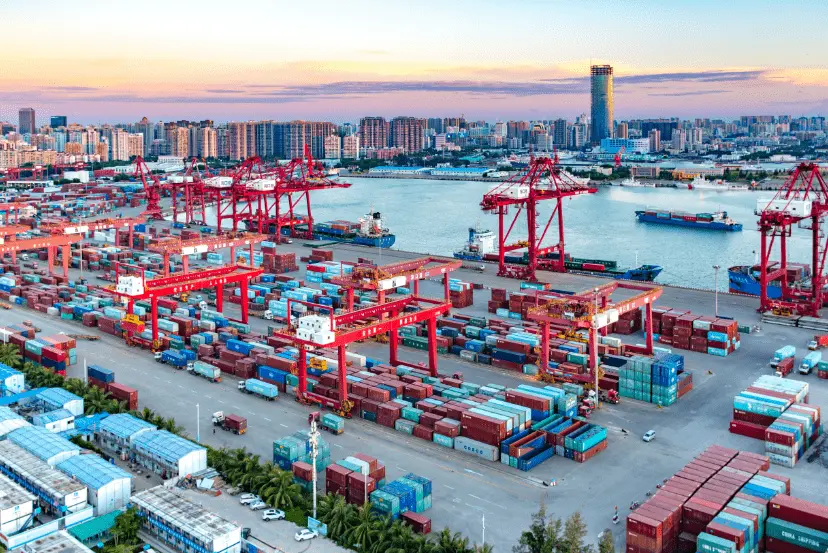
Colombia’s Free-Trade Zones Send a Mixed Signal: Exports Down 21% as Imports Rise. (Photo Internet reproduction)
One-stop reference
Company Intelligence
Every listed company in Latin America — financials, ownership and structure for 1,450+ companies across 26 exchanges, in one place.
Browse the directory →
RT
Ask Rio Times
17 years of Latin America reporting, on demand.
Open the full Ask Rio Times →

When their exports fall while imports of inputs rise, it often means manufacturers are restocking or upgrading equipment but facing thinner demand abroad.

The pattern isn’t a one-off: mid-year data also showed zone exports slipping in June and July, with imports notably strong. Nationally, Colombia’s overall exports across all regimes were essentially flat in August, reinforcing the idea that external demand is soft.

Why this should matter to readers outside Colombia: free-trade zones are the country’s factory floor and logistics nerve endings.

Their trade flows are early clues for jobs, trucking volumes, and airport cargo in surrounding cities—and for suppliers and buyers across the Americas.

If imports of components stay firm and exports stabilize into the fourth quarter, output could rebound. If exports keep shrinking, companies may trim purchases next, chilling investment plans.

In short: fewer outbound boxes, more inbound parts. That split is a timely readout on Colombia’s manufacturing pulse—and a useful heads-up for supply-chain planners watching Latin America.

This article was produced by The Rio Times’ automated newsroom system. How we use AI · Report an error

Read More from The Rio Times

The Rio Times · Power Map
See who really holds power in Latin America
Click to open the Power Map

Rotate for Best Experience

This report is optimized for landscape viewing. Rotate your phone for the full experience.