Brazil: The most expensive neighborhoods in São Paulo, Rio, and Belo Horizonte
Real estate is more expensive in São Paulo and Rio de Janeiro, while in the Minas Gerais capital, Belo Horizonte, there was a drop in prices.
That is what a survey by the QuintoAndar platform shows, which calculated the average value of the square meter for sale in these cities in the second quarter.
In São Paulo, the average price of the square meter for sale rose 0.96% compared to the first three months of the year and 5.14% compared to the second quarter of last year.

Among the contracts closed in the period, the average amount charged for the square meter was R$6,731 (US$1,274), which would make a 50-square-meter apartment cost R$336,550.
The average asking price in the platform’s ads is R$7,000, which means an average discount of 3.9% between the asking price and the contracts closed in the quarter.
The Hiperdados platform also released information about the square meter price in São Paulo, but for units being launched or under construction. The average value was R$10,899 in July, making a 50-square-meter property cost R$544,950. The value is almost 10% higher than 12 months ago.
According to QuintoAndar, the list of neighborhoods with the most expensive square meters is headed by Pinheiros, in the West Zone, with an average price of R$11,440. Moema, in the South Zone, is the second most expensive (R$10,938), followed by Consolação in the central region (R$9,582).
QuintoAndar also separated the five neighborhoods with the biggest jump in price per square meter in the quarter.
The highlight is Brooklin, in the South zone, which saw an advance of 25%. Vila Andrade (South zone) was second place in the appreciation ranking, with a 5.8% increase, followed by Tatuapé (3.6%), Panamby (2.8%), and Consolação (1.9%).
For Thiago Reis, QuintoAndar’s data manager, the appreciation is a sign that the buying and selling market is still heated in the city, despite the higher interest rates for financing.
“The sales market is less optimistic but still heated. Despite the increase in the cost of real estate credit, the Brazilian market is used to operating with very high interest rates,” he said in a statement.
It is worth pointing out that the most expensive and most valued neighborhoods are not necessarily the most sought after by platform users.
The interest of those who visit the site is concentrated in the city’s expanded center (between the Pinheiros and Tietê riverside expressways) and neighboring neighborhoods.
Among the ten most popular neighborhoods are Mooca, Bela Vista, Santana, and Butantã.
The ten most sought-after neighborhoods in São Paulo:
1. Vila Mariana
2. Tatuapé
3. Mooca
4. Pinheiros
5. Moema
6. Bela Vista
7. Ipiranga
8. Santana
9. Perdizes
10. Butantã
RIO DE JANEIRO
In Rio de Janeiro, the average price of the square meter for sale was R$5,115, up 4.52% compared to the first quarter of this year and 4.1% compared to the second quarter of 2021.
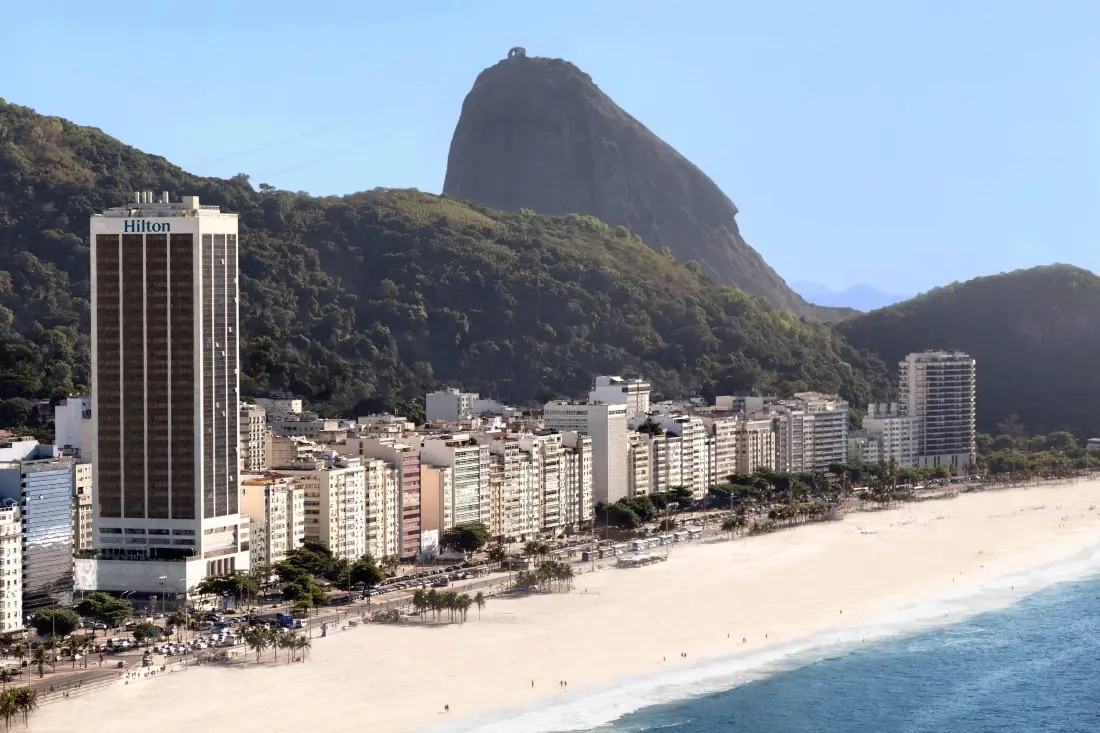
According to the platform, the price increase occurred mainly in neighborhoods in the North and South zones of Rio de Janeiro, which appreciated 16.4% and 10.7%, respectively.
The average square meter price in the South Zone (R$11,072) is more than double the city’s average.
The average discount between the asking price and the price paid by buyers was 4.9% in Rio.
QuintoAndar did not separate the value of the square meter by neighborhoods in Rio de Janeiro but by regions.
After the South Zone, the most expensive is the Center (R$5,544), followed by the West Zone (R$4,700) and the North Zone (R$4,103).
The only region that reduced its square meter price, compared to the second quarter of last year, was the West, with a drop of about 8%.
The most sought-after neighborhood in the city is Tijuca, in the North zone, followed by the almost homonymous Barra da Tijuca in the West zone.
The ten most sought after neighborhoods in Rio de Janeiro:
1. Tijuca
2. Barra da Tijuca
3. Copacabana
4. Recreio
5. Botafogo
6. Ipanema
7. Flamengo
8. Méier
9. Jacarepaguá
10. Freguesia
BELO HORIZONTE
Unlike São Paulo and Rio de Janeiro, Belo Horizonte presented a drop in the average price of the square meter in the second quarter.
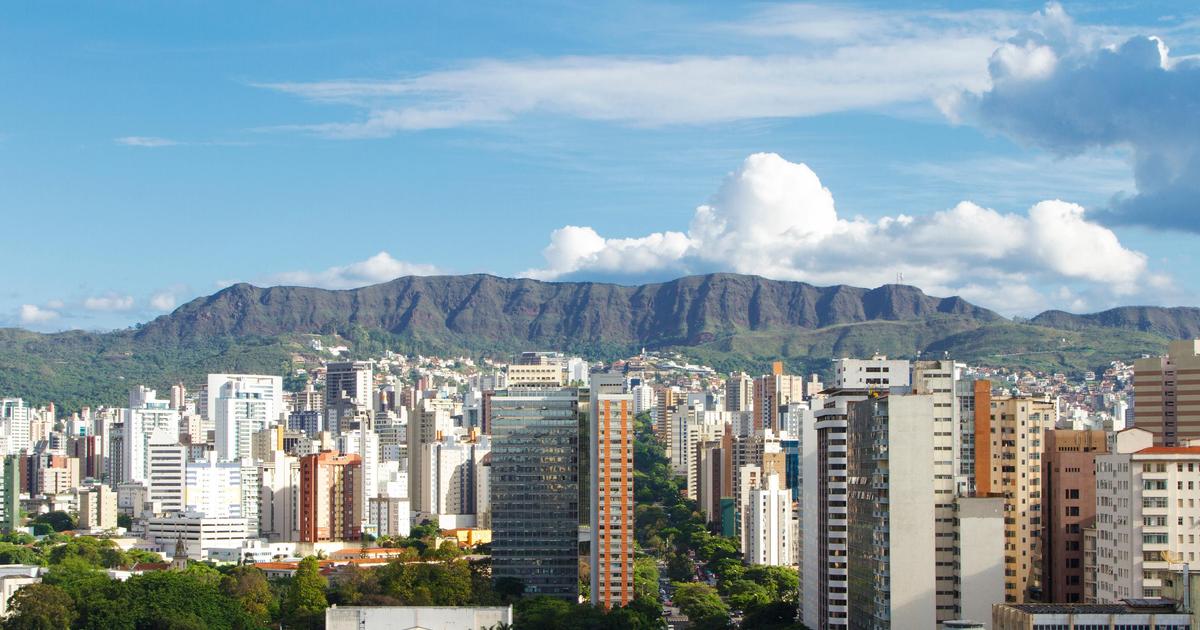
The value decreased 3.1% compared to the first three months of the year and 1.49% compared to the second quarter of last year, to R$4,764.
The average discount between the asking price and the closed contract value was 4.2% in the period.
The most valued neighborhood in the city, however, charges more than double the average of the capital city. It is Funcionários, with a square meter sold at R$9,614 on average.
It is followed by Savassi (R$ 9.250), at the top of the ten most expensive neighborhoods list.
QuintoAndar also mapped the most sought-after neighborhoods by users in Belo Horizonte. In the most expensive neighborhoods, only Sion, Santo Antônio, and Lourdes appear among the most sought-after in the city.
The ten most sought after neighborhoods in Belo Horizonte:
1. Hawaii
2. Buritis
3. Santo Antônio
4. Carlos Prates
5. Jardim América
6. Centro
7. Holy Family
8. Sion
9. Meadow
10. Lourdes
With information from Valor Econômico
More: Brazil news in English, every day from The Rio Times.
This article was produced by The Rio Times’ automated newsroom system. How we use AI · Report an error · Editorial responsibility: Matthias Camenzind, Editor-in-Chief