IBOV 180,230.99 ▲ 1.59% IPSA 11,315.26 ▼ 1.14% IPC MEX 65,314.78 ▼ 0.18% MERVAL 3,070,880 ▲ 1.22% COLCAP 2,467.03 ▲ 1.73% BVL PERÚ 59,450.29 ▲ 0.04% USD/BRL5.15▼ 0.69% USD/MXN16.97▼ 0.15% USD/CLP934.61▲ 0.04% USD/COP3,174▼ 0.86% USD/PEN3.36▼ 0.17% USD/ARS1,512▲ 0.18% USD/UYU40.24▲ 0.68% USD/PYG5,873▲ 0.47% USD/BOB12.08▲ 3.98% USD/DOP58.50▲ 0.27% USD/CRC446.47▲ 1.09% USD/GTQ7.62▲ 1.63% USD/HNL26.84▲ 1.11% USD/NIO36.62▲ 0.14% USD/VES796.33▼ 0.13% USD/PAB1.00— 0.00% USD/BZD2.00— 0.00% USD/JMD 157.28 — 0.00% USD/TTD6.69▼ 0.06% EUR/BRL5.97▼ 0.73% BRENT 88.88 ▼ 0.03% WTI 83.11 ▼ 0.11% IRON ORE 161.91 — — COPPER 6.61 ▲ 0.03% GOLD 4,461 ▲ 1.78% SILVER 65.59 ▲ 1.26% SOY 1,184 ▲ 3.20% CORN 480.50 ▲ 10.02% WHEAT 655.00 ▲ 3.93% COFFEE 317.25 ▼ 5.51% SUGAR 16.43 ▼ 1.79% ORANGE JUICE 138.55 ▼ 0.47% COTTON 85.03 ▲ 2.33% COCOA 5,719 ▲ 3.18% BEEF 223.60 ▼ 3.93% CATTLE 339.10 ▼ 3.16% LITHIUM 75.20 ▲ 1.47% PETR4 41.64 ▼ 0.05% VALE3 72.97 ▲ 0.83% ITUB4 38.60 ▼ 1.03% BBDC4 16.85 ▲ 0.36% ABEV3 14.89 ▼ 0.80% BBAS3 19.37 ▲ 0.47% B3SA3 14.26 ▼ 0.21% WEGE3 47.59 ▲ 0.49% PRIO3 59.14 ▼ 0.19% SUZB3 41.33 ▲ 2.35% RENT3 34.68 ▼ 0.09% AZZA3 15.89 ▼ 2.63% CSAN3 3.22 ▼ 1.83% RAIZ4 0.25 — 0.00% PCAR3 2.75 ▼ 0.36% GMAT3 3.65 ▼ 1.08% PSSA3 48.13 ▼ 0.54% CVCB3 1.33 ▼ 2.92% POSI3 3.36 ▲ 2.44% SLCE3 13.34 ▲ 0.30% NATU3 8.14 ▼ 0.73% IBOV 180,230.99 ▲ 1.59% IPSA 11,315.26 ▼ 1.14% IPC MEX 65,314.78 ▼ 0.18% MERVAL 3,070,880 ▲ 1.22% COLCAP 2,467.03 ▲ 1.73% BVL PERÚ 59,450.29 ▲ 0.04% USD/BRL 5.16 ▲ 0.01% USD/MXN 17.06 ▼ 0.24% USD/CLP 913.98 ▲ 0.04% USD/COP 3,140 ▲ 0.03% USD/PEN 3.36 ▼ 0.66% USD/ARS 1,493 ▲ 0.10% USD/UYU 40.27 ▲ 1.24% USD/PYG 5,939 ▲ 1.68% USD/BOB 11.64 ▼ 0.76% USD/DOP 58.34 ▲ 1.25% USD/CRC 445.92 ▲ 0.89% USD/GTQ 7.62 ▲ 2.21% USD/HNL 26.79 ▲ 1.57% USD/NIO 36.62 ▲ 0.69% USD/VES 762.44 ▼ 0.13% USD/PAB 1.00 — 0.00% USD/BZD 2.00 — 0.00% USD/JMD 157.28 — 0.00% USD/TTD 6.70 ▲ 0.61% EUR/BRL 5.95 ▲ 1.01% BRENT 88.88 ▼ 0.03% WTI 83.11 ▼ 0.11% IRON ORE 161.91 — — COPPER 6.61 ▲ 0.03% GOLD 4,461 ▲ 1.78% SILVER 65.59 ▲ 1.26% SOY 1,184 ▲ 3.20% CORN 480.50 ▲ 10.02% WHEAT 655.00 ▲ 3.93% COFFEE 317.25 ▼ 5.51% SUGAR 16.43 ▼ 1.79% ORANGE JUICE 138.55 ▼ 0.47% COTTON 85.03 ▲ 2.33% COCOA 5,719 ▲ 3.18% BEEF 223.60 ▼ 3.93% CATTLE 339.10 ▼ 3.16% LITHIUM 75.20 ▲ 1.47% PETR4 41.64 ▼ 0.05% VALE3 72.97 ▲ 0.83% ITUB4 38.60 ▼ 1.03% BBDC4 16.85 ▲ 0.36% ABEV3 14.89 ▼ 0.80% BBAS3 19.37 ▲ 0.47% B3SA3 14.26 ▼ 0.21% WEGE3 47.59 ▲ 0.49% PRIO3 59.14 ▼ 0.19% SUZB3 41.33 ▲ 2.35% RENT3 34.68 ▼ 0.09% AZZA3 15.89 ▼ 2.63% CSAN3 3.22 ▼ 1.83% RAIZ4 0.25 — 0.00% PCAR3 2.75 ▼ 0.36% GMAT3 3.65 ▼ 1.08% PSSA3 48.13 ▼ 0.54% CVCB3 1.33 ▼ 2.92% POSI3 3.36 ▲ 2.44% SLCE3 13.34 ▲ 0.30% NATU3 8.14 ▼ 0.73%
since 2009
Tuesday, September 1, 2026

Latin America Mexico

Mexico’s Fragile Growth Exposed as Nearshoring Hopes Fade

By · March 4, 2025 · 2 min read

Daily Brief

The morning intel from across Latin America. Free.

By subscribing you agree to our privacy policy. We never share your email.

Mexico’s economic struggles, long masked by foreign investment and remittance inflows, now face renewed scrutiny as former U.S. President Donald Trump’s 25% tariff threats imperil the country’s nearshoring boom.

Between 1980 and 2022, Mexico’s GDP grew at a modest average of just over 2% annually, primarily driven by external factors rather than internal strength. The recent surge in foreign investment tied to nearshoring had sparked optimism, with growth exceeding 3% in 2022 and 2023.

However, these hopes are rapidly unraveling, leaving Mexico vulnerable to its persistent structural weaknesses. Trump’s tariff threats jeopardize $839 billion in annual U.S.-Mexico trade and could push Mexico into recession.

The manufacturing and automotive sectors—key drivers of exports—are particularly exposed. Over 80% of the 3.4 million vehicles Mexico exports annually go to the United States.

Companies like Prommont have already cut profit margins to retain clients amid uncertainty, while industrial developers in Monterrey offer rent discounts to keep tenants.
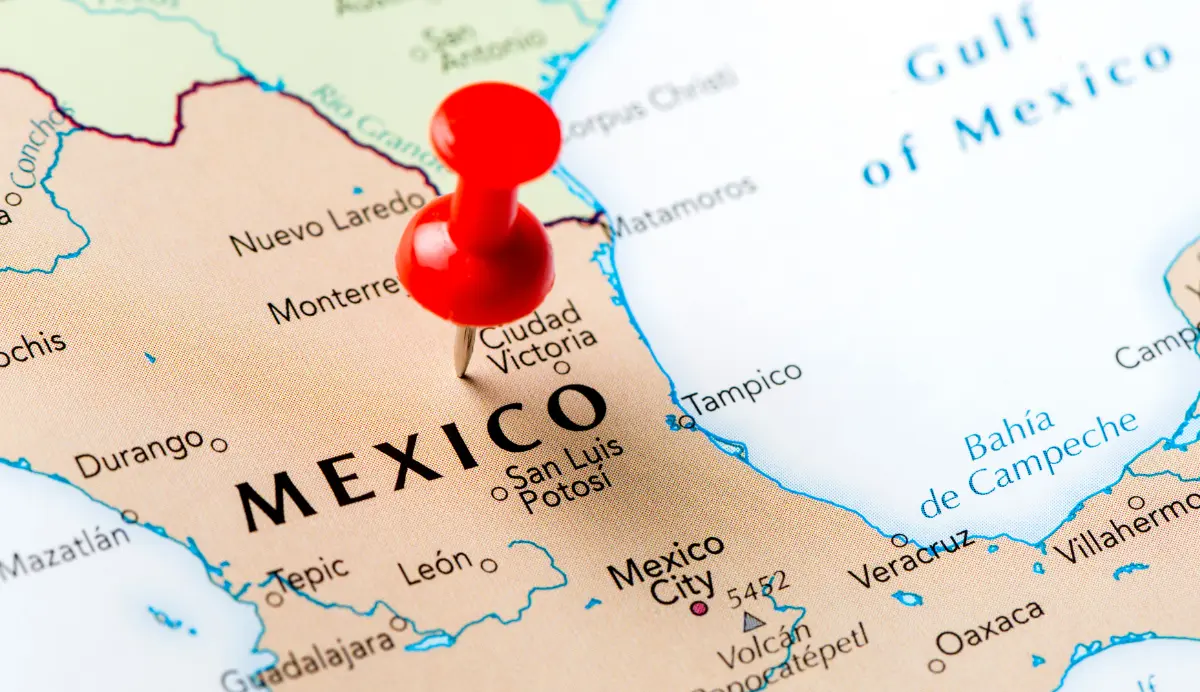
Mexico’s Fragile Growth Exposed as Nearshoring Hopes Fade
Mexico’s Fragile Growth Exposed as Nearshoring Hopes Fade. (Photo Internet reproduction)
One-stop reference
Company Intelligence
Every listed company in Latin America — financials, ownership and structure for 1,450+ companies across 26 exchanges, in one place.
Browse the directory →
RT
Ask Rio Times
17 years of Latin America reporting, on demand.
Open the full Ask Rio Times →

The country’s reliance on foreign capital underscores its economic fragility. Foreign direct investment surged after trade liberalization in the 1980s but has consistently outpaced domestic investment, which remains sluggish.

Mexico Faces Economic Challenges

Remittances from the U.S., totaling $64.7 billion (R$388 billion) in 2024, accounted for roughly 4% of GDP and remain a lifeline for millions of Mexican families. Yet mass deportations or a U.S. recession could disrupt this critical income stream.

Internally, Mexico grapples with corruption and cartel influence, particularly in northern states where criminal groups wield significant power. President Claudia Sheinbaum inherited a fiscal deficit of 5.9% of GDP in 2024 due to costly infrastructure projects under her predecessor Andrés Manuel López Obrador (AMLO).

Her administration aims to reduce the deficit to 3.9% in 2025 through spending cuts, but this risks further stifling growth. As nearshoring momentum slows and U.S.-Mexico trade relations deteriorate, Mexico risks losing its status as the gateway to the U.S. market under the USMCA framework.

Without structural reforms to address corruption and improve governance, Mexico remains deeply dependent on external forces for growth—a precarious position as global economic uncertainties mount.

Key Facts

Deep Dive

For the complete picture, read our in-depth guide: Mexico Economy 2026: GDP, Peso, Nearshoring, Banxico and Trade

This article was produced by The Rio Times’ automated newsroom system. How we use AI · Report an error

Read More from The Rio Times

The Rio Times · Power Map
See who really holds power in Latin America
Click to open the Power Map

Rotate for Best Experience

This report is optimized for landscape viewing. Rotate your phone for the full experience.