IBOV 177,418.78 ▲ 1.00% IPSA 11,315.26 ▼ 1.14% IPC MEX 65,430.32 ▼ 0.08% MERVAL 3,033,848 — 0.00% COLCAP 2,425.08 ▼ 1.33% BVL PERÚ 59,928.30 ▼ 0.80% USD/BRL5.19▲ 0.15% USD/MXN16.99▼ 0.04% USD/CLP939.10▲ 0.52% USD/COP3,223▲ 0.68% USD/PEN3.36▼ 0.14% USD/ARS1,509▼ 0.28% USD/UYU40.29▲ 0.05% USD/PYG5,892▼ 0.13% USD/BOB11.84▲ 0.51% USD/DOP58.61▲ 0.46% USD/CRC446.47▼ 0.04% USD/GTQ7.62▼ 0.02% USD/HNL26.84— 0.00% USD/NIO36.62▲ 0.14% USD/VES796.33▲ 0.29% USD/PAB1.00— 0.00% USD/BZD2.00— 0.00% USD/JMD 157.28 — 0.00% USD/TTD6.69▼ 0.37% EUR/BRL6.02▲ 0.19% BRENT 88.88 ▼ 0.03% WTI 83.11 ▼ 0.11% IRON ORE 161.91 — — COPPER 6.61 ▲ 0.03% GOLD 4,461 ▲ 1.78% SILVER 65.59 ▲ 1.26% SOY 1,184 ▲ 3.20% CORN 480.50 ▲ 10.02% WHEAT 655.00 ▲ 3.93% COFFEE 317.25 ▼ 5.51% SUGAR 16.43 ▼ 1.79% ORANGE JUICE 138.55 ▼ 0.47% COTTON 85.03 ▲ 2.33% COCOA 5,719 ▲ 3.18% BEEF 223.60 ▼ 3.93% CATTLE 339.10 ▼ 3.16% LITHIUM 75.20 ▲ 1.47% PETR4 41.64 ▼ 0.05% VALE3 72.97 ▲ 0.83% ITUB4 38.60 ▼ 1.03% BBDC4 16.85 ▲ 0.36% ABEV3 14.89 ▼ 0.80% BBAS3 19.37 ▲ 0.47% B3SA3 14.26 ▼ 0.21% WEGE3 47.59 ▲ 0.49% PRIO3 59.14 ▼ 0.19% SUZB3 41.33 ▲ 2.35% RENT3 34.68 ▼ 0.09% AZZA3 15.89 ▼ 2.63% CSAN3 3.22 ▼ 1.83% RAIZ4 0.25 — 0.00% PCAR3 2.75 ▼ 0.36% GMAT3 3.65 ▼ 1.08% PSSA3 48.13 ▼ 0.54% CVCB3 1.33 ▼ 2.92% POSI3 3.36 ▲ 2.44% SLCE3 13.34 ▲ 0.30% NATU3 8.14 ▼ 0.73% IBOV 177,418.78 ▲ 1.00% IPSA 11,315.26 ▼ 1.14% IPC MEX 65,430.32 ▼ 0.08% MERVAL 3,033,848 — 0.00% COLCAP 2,425.08 ▼ 1.33% BVL PERÚ 59,928.30 ▼ 0.80% USD/BRL 5.16 ▲ 0.01% USD/MXN 17.06 ▼ 0.24% USD/CLP 913.98 ▲ 0.04% USD/COP 3,140 ▲ 0.03% USD/PEN 3.36 ▼ 0.66% USD/ARS 1,493 ▲ 0.10% USD/UYU 40.27 ▲ 1.24% USD/PYG 5,939 ▲ 1.68% USD/BOB 11.64 ▼ 0.76% USD/DOP 58.34 ▲ 1.25% USD/CRC 445.92 ▲ 0.89% USD/GTQ 7.62 ▲ 2.21% USD/HNL 26.79 ▲ 1.57% USD/NIO 36.62 ▲ 0.69% USD/VES 762.44 ▼ 0.13% USD/PAB 1.00 — 0.00% USD/BZD 2.00 — 0.00% USD/JMD 157.28 — 0.00% USD/TTD 6.70 ▲ 0.61% EUR/BRL 5.95 ▲ 1.01% BRENT 88.88 ▼ 0.03% WTI 83.11 ▼ 0.11% IRON ORE 161.91 — — COPPER 6.61 ▲ 0.03% GOLD 4,461 ▲ 1.78% SILVER 65.59 ▲ 1.26% SOY 1,184 ▲ 3.20% CORN 480.50 ▲ 10.02% WHEAT 655.00 ▲ 3.93% COFFEE 317.25 ▼ 5.51% SUGAR 16.43 ▼ 1.79% ORANGE JUICE 138.55 ▼ 0.47% COTTON 85.03 ▲ 2.33% COCOA 5,719 ▲ 3.18% BEEF 223.60 ▼ 3.93% CATTLE 339.10 ▼ 3.16% LITHIUM 75.20 ▲ 1.47% PETR4 41.64 ▼ 0.05% VALE3 72.97 ▲ 0.83% ITUB4 38.60 ▼ 1.03% BBDC4 16.85 ▲ 0.36% ABEV3 14.89 ▼ 0.80% BBAS3 19.37 ▲ 0.47% B3SA3 14.26 ▼ 0.21% WEGE3 47.59 ▲ 0.49% PRIO3 59.14 ▼ 0.19% SUZB3 41.33 ▲ 2.35% RENT3 34.68 ▼ 0.09% AZZA3 15.89 ▼ 2.63% CSAN3 3.22 ▼ 1.83% RAIZ4 0.25 — 0.00% PCAR3 2.75 ▼ 0.36% GMAT3 3.65 ▼ 1.08% PSSA3 48.13 ▼ 0.54% CVCB3 1.33 ▼ 2.92% POSI3 3.36 ▲ 2.44% SLCE3 13.34 ▲ 0.30% NATU3 8.14 ▼ 0.73%
since 2009
Tuesday, September 1, 2026

Latin America Central America

U.S. Policies Slash Migration Through Darién Gap by 96%, Highlighting Regional Impact

By · March 3, 2025 · 2 min read

Daily Brief

The morning intel from across Latin America. Free.

By subscribing you agree to our privacy policy. We never share your email.

The flow of migrants crossing the treacherous Darién Gap, a dense jungle linking Colombia and Panama, has plummeted by 96% in early 2025 compared to the same period last year.

Official data from Panama’s National Migration Service (SNM) reveals that only 2,637 migrants traversed the region by February 28, a stark contrast to the 72,294 recorded during the same timeframe in 2024.

This dramatic decline reflects the combined effects of stricter U.S. immigration policies under President Donald Trump and enhanced enforcement measures by Panamanian authorities.

Panama attributes part of this decline to its closure of informal jungle trails. It has also established a single “humanitarian corridor” through the Darién.

These measures aim to curb illegal migration while mitigating environmental damage in one of the world’s most biodiverse regions. Seasonal factors, such as heavy rains, have also played a role in discouraging crossings through this perilous route.
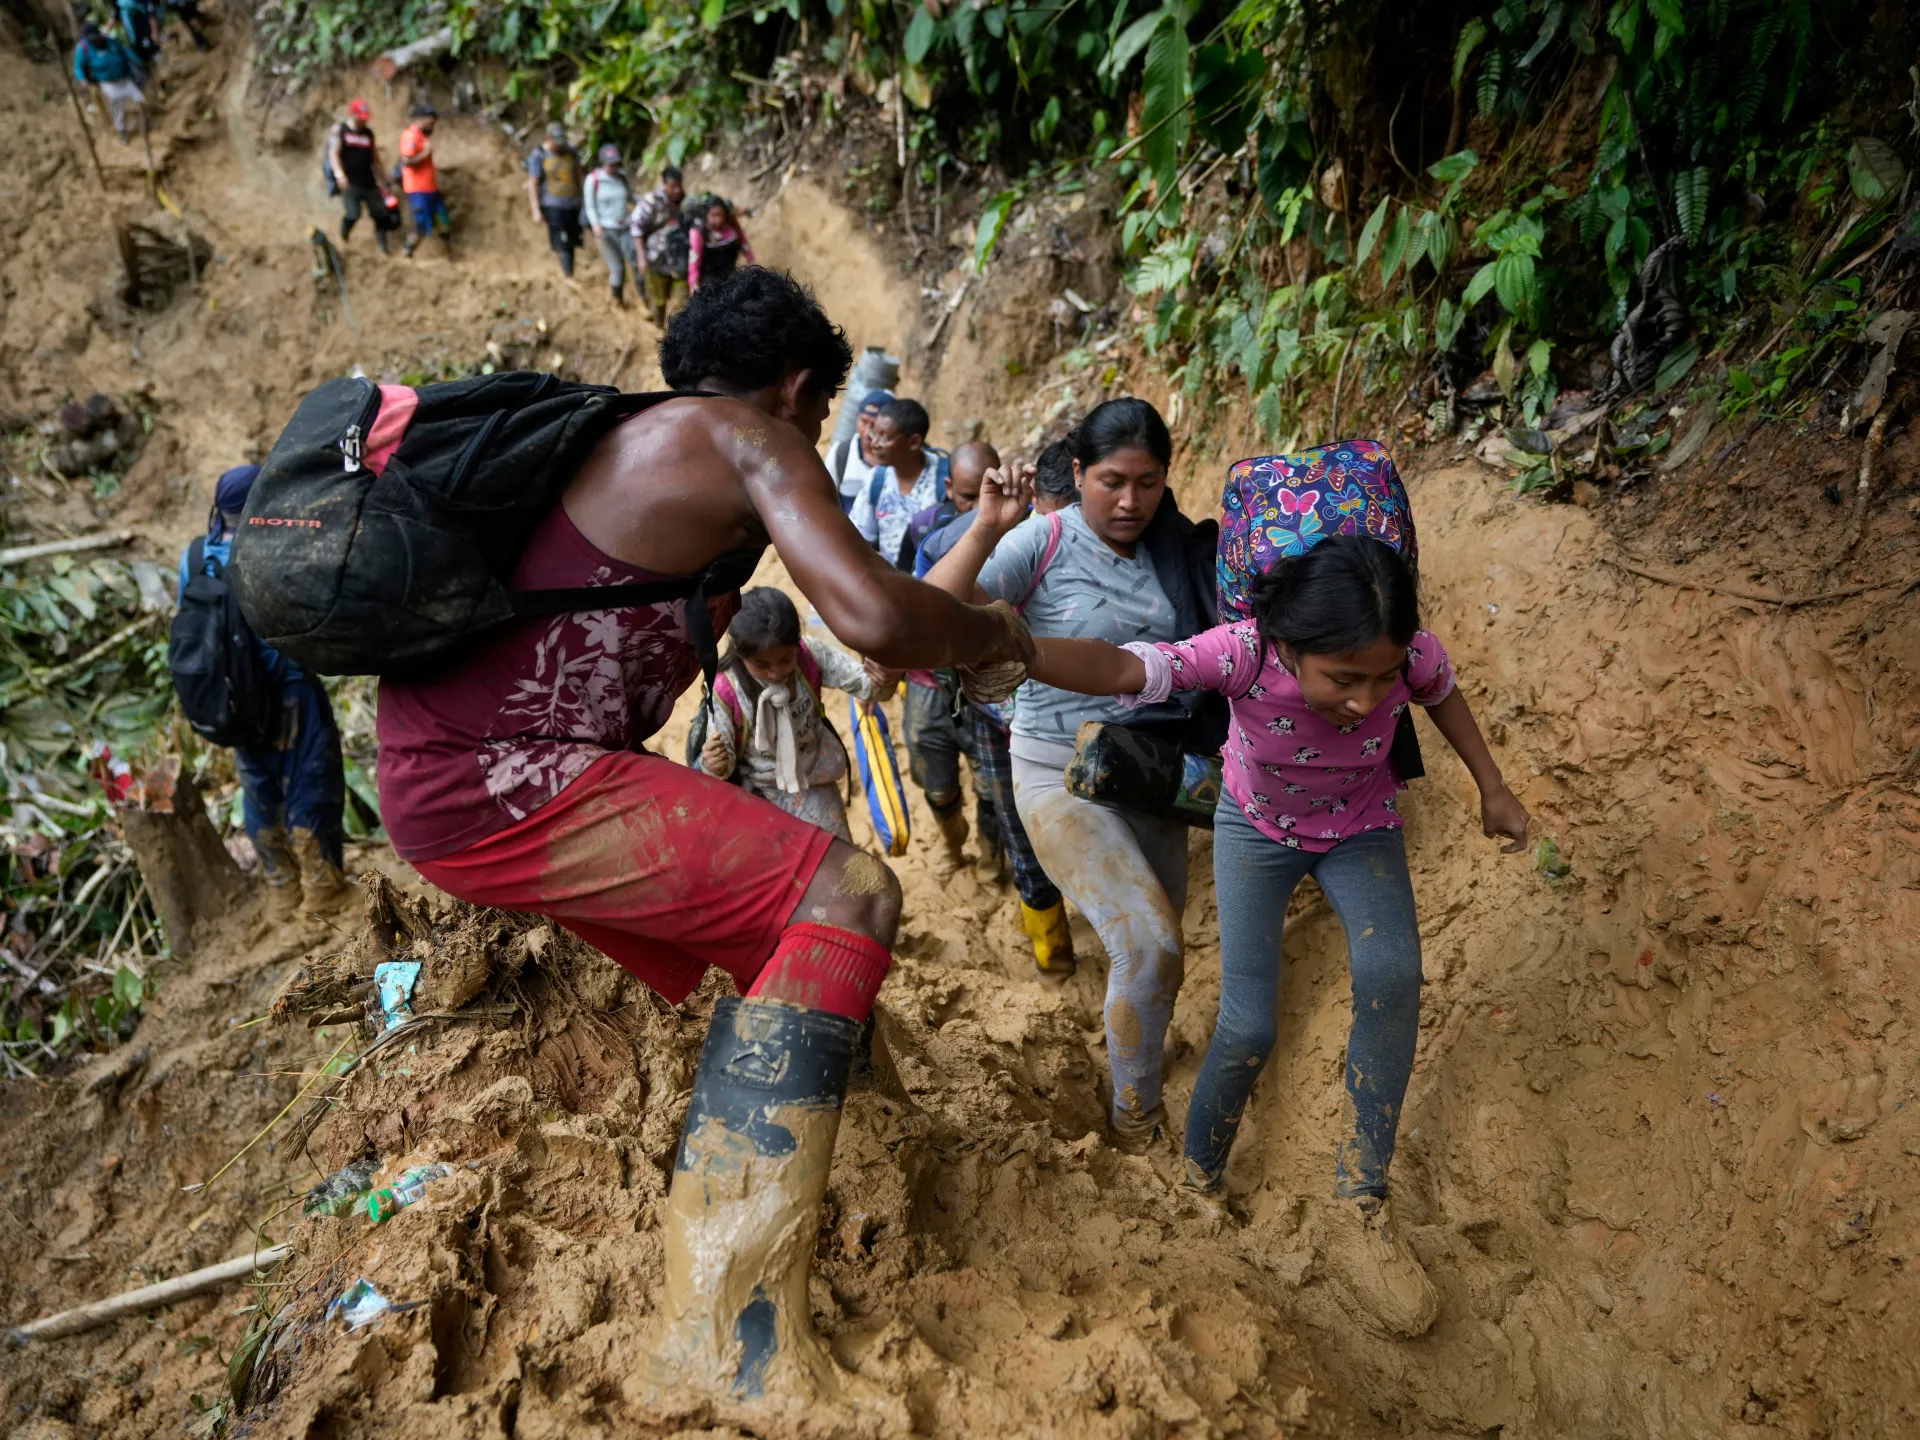
U.S. Policies Slash Migration Through Darién Gap by 96%, Highlighting Regional Impact
U.S. Policies Slash Migration Through Darién Gap by 96%, Highlighting Regional Impact. (Photo Internet reproduction)
One-stop reference
Company Intelligence
Every listed company in Latin America — financials, ownership and structure for 1,450+ companies across 26 exchanges, in one place.
Browse the directory →
RT
Ask Rio Times
17 years of Latin America reporting, on demand.
Open the full Ask Rio Times →

However, U.S. immigration policies have been pivotal in reshaping migration patterns. The Trump administration introduced a new registration requirement on February 25 for foreign nationals staying in the U.S. for over 30 days.

Panama’s Crackdown on Irregular Migration

Non-compliance carries penalties of up to $833 (R$5,000) and six months in prison, effectively criminalizing irregular migration. Additionally, a bilateral agreement signed in July 2024 between Panama and the U.S. has facilitated over 40 deportation flights financed by Washington, targeting migrants from various countries who entered Panama illegally.

This shift has created ripple effects across the region. Migrants from Venezuela, Colombia, and other nations increasingly reconsider their journeys northward due to heightened risks and limited options at the U.S.-Mexico border. In January alone, Panama reported just over 2,200 crossings—down from nearly 35,000 during the same month in 2024.

Despite these reductions, humanitarian challenges persist. Migrants arriving in Panama often face dire conditions after enduring grueling journeys through the jungle. Reception centers remain overwhelmed despite international support, and deported individuals frequently encounter uncertain futures.

The steep drop in migration underscores the profound impact of coordinated international policies but raises questions about their long-term sustainability.

As migration flows shift southward or stall entirely, countries like Panama face increasing responsibility for managing displaced populations. This comes amid growing regional tensions and limited resources.

This article was drafted with automated assistance and reviewed before publication. How we use AI · Report an error

Read More from The Rio Times

The Rio Times · Power Map
See who really holds power in Latin America
Click to open the Power Map

Rotate for Best Experience

This report is optimized for landscape viewing. Rotate your phone for the full experience.