IBOV 205,430.33 ▲ 0.54% IPSA 10,969.16 ▼ 0.02% IPC MEX 68,929.72 ▲ 1.87% MERVAL 2,848,945 ▼ 0.35% COLCAP 2,566.28 ▼ 0.55% BVL PERÚ 60,210.69 ▼ 0.91% USD/BRL5.07▲ 0.09% USD/MXN18.50▲ 0.45% USD/CLP984.38— 0.00% USD/COP3,171▼ 0.15% USD/PEN3.43▼ 0.11% USD/ARS1,518▲ 0.30% USD/UYU40.13▲ 3.08% USD/PYG5,686▲ 3.07% USD/BOB11.61▲ 2.27% USD/DOP61.26▲ 0.43% USD/CRC448.47▲ 1.59% USD/GTQ7.65▲ 3.30% USD/HNL26.86▲ 0.34% USD/NIO36.62▲ 2.76% USD/VES877.92▼ 0.13% USD/PAB1.00— 0.00% USD/BZD2.00— 0.00% USD/JMD 157.28 — 0.00% USD/TTD6.73▲ 2.13% EUR/BRL5.71▲ 1.16% BRENT 88.88 ▼ 0.03% WTI 83.11 ▼ 0.11% IRON ORE 161.91 — — COPPER 6.61 ▲ 0.03% GOLD 4,461 ▲ 1.78% SILVER 65.59 ▲ 1.26% SOY 1,184 ▲ 3.20% CORN 480.50 ▲ 10.02% WHEAT 655.00 ▲ 3.93% COFFEE 317.25 ▼ 5.51% SUGAR 16.43 ▼ 1.79% ORANGE JUICE 138.55 ▼ 0.47% COTTON 85.03 ▲ 2.33% COCOA 5,719 ▲ 3.18% BEEF 223.60 ▼ 3.93% CATTLE 339.10 ▼ 3.16% LITHIUM 75.20 ▲ 1.47% PETR4 41.64 ▼ 0.05% VALE3 72.97 ▲ 0.83% ITUB4 38.60 ▼ 1.03% BBDC4 16.85 ▲ 0.36% ABEV3 14.89 ▼ 0.80% BBAS3 19.37 ▲ 0.47% B3SA3 14.26 ▼ 0.21% WEGE3 47.59 ▲ 0.49% PRIO3 59.14 ▼ 0.19% SUZB3 41.33 ▲ 2.35% RENT3 34.68 ▼ 0.09% AZZA3 15.89 ▼ 2.63% CSAN3 3.22 ▼ 1.83% RAIZ4 0.25 — 0.00% PCAR3 2.75 ▼ 0.36% GMAT3 3.65 ▼ 1.08% PSSA3 48.13 ▼ 0.54% CVCB3 1.33 ▼ 2.92% POSI3 3.36 ▲ 2.44% SLCE3 13.34 ▲ 0.30% NATU3 8.14 ▼ 0.73% IBOV 205,430.33 ▲ 0.54% IPSA 10,969.16 ▼ 0.02% IPC MEX 68,929.72 ▲ 1.87% MERVAL 2,848,945 ▼ 0.35% COLCAP 2,566.28 ▼ 0.55% BVL PERÚ 60,210.69 ▼ 0.91% USD/BRL 5.16 ▲ 0.01% USD/MXN 17.06 ▼ 0.24% USD/CLP 913.98 ▲ 0.04% USD/COP 3,140 ▲ 0.03% USD/PEN 3.36 ▼ 0.66% USD/ARS 1,493 ▲ 0.10% USD/UYU 40.27 ▲ 1.24% USD/PYG 5,939 ▲ 1.68% USD/BOB 11.64 ▼ 0.76% USD/DOP 58.34 ▲ 1.25% USD/CRC 445.92 ▲ 0.89% USD/GTQ 7.62 ▲ 2.21% USD/HNL 26.79 ▲ 1.57% USD/NIO 36.62 ▲ 0.69% USD/VES 762.44 ▼ 0.13% USD/PAB 1.00 — 0.00% USD/BZD 2.00 — 0.00% USD/JMD 157.28 — 0.00% USD/TTD 6.70 ▲ 0.61% EUR/BRL 5.95 ▲ 1.01% BRENT 88.88 ▼ 0.03% WTI 83.11 ▼ 0.11% IRON ORE 161.91 — — COPPER 6.61 ▲ 0.03% GOLD 4,461 ▲ 1.78% SILVER 65.59 ▲ 1.26% SOY 1,184 ▲ 3.20% CORN 480.50 ▲ 10.02% WHEAT 655.00 ▲ 3.93% COFFEE 317.25 ▼ 5.51% SUGAR 16.43 ▼ 1.79% ORANGE JUICE 138.55 ▼ 0.47% COTTON 85.03 ▲ 2.33% COCOA 5,719 ▲ 3.18% BEEF 223.60 ▼ 3.93% CATTLE 339.10 ▼ 3.16% LITHIUM 75.20 ▲ 1.47% PETR4 41.64 ▼ 0.05% VALE3 72.97 ▲ 0.83% ITUB4 38.60 ▼ 1.03% BBDC4 16.85 ▲ 0.36% ABEV3 14.89 ▼ 0.80% BBAS3 19.37 ▲ 0.47% B3SA3 14.26 ▼ 0.21% WEGE3 47.59 ▲ 0.49% PRIO3 59.14 ▼ 0.19% SUZB3 41.33 ▲ 2.35% RENT3 34.68 ▼ 0.09% AZZA3 15.89 ▼ 2.63% CSAN3 3.22 ▼ 1.83% RAIZ4 0.25 — 0.00% PCAR3 2.75 ▼ 0.36% GMAT3 3.65 ▼ 1.08% PSSA3 48.13 ▼ 0.54% CVCB3 1.33 ▼ 2.92% POSI3 3.36 ▲ 2.44% SLCE3 13.34 ▲ 0.30% NATU3 8.14 ▼ 0.73%
since 2009
Saturday, October 17, 2026

World-News North America

U.S. Trade Deficit Hits Record $131 Billion in January as Businesses Rush Imports Ahead of Tariffs

By · March 6, 2025 · 2 min read

The U.S. trade deficit reached a record $131.4 billion in January, driven by a sharp rise in imports as businesses moved to secure goods before new tariffs took effect in March.

Data from the Commerce Department shows a 34% increase from December’s revised $98.1 billion deficit, marking the largest monthly jump since 2015. Imports surged 10% to $401.2 billion, the highest on record, with goods imports rising 12.3% to $329.5 billion.

Businesses accelerated shipments of industrial supplies and materials, which increased by $23.1 billion, including significant imports of gold. Consumer goods imports rose by $6 billion, led by pharmaceuticals, cell phones, and household items.

Meanwhile, capital goods imports grew by $4.6 billion due to higher demand for computers and telecom equipment. Exports increased modestly by 1.2% to $269.8 billion, with goods exports up 1.6% to $172.8 billion.

Capital goods exports, including civilian aircraft and semiconductors, added $4.2 billion. Meanwhile, consumer goods exports such as pharmaceuticals and jewelry rose by $1.7 billion.
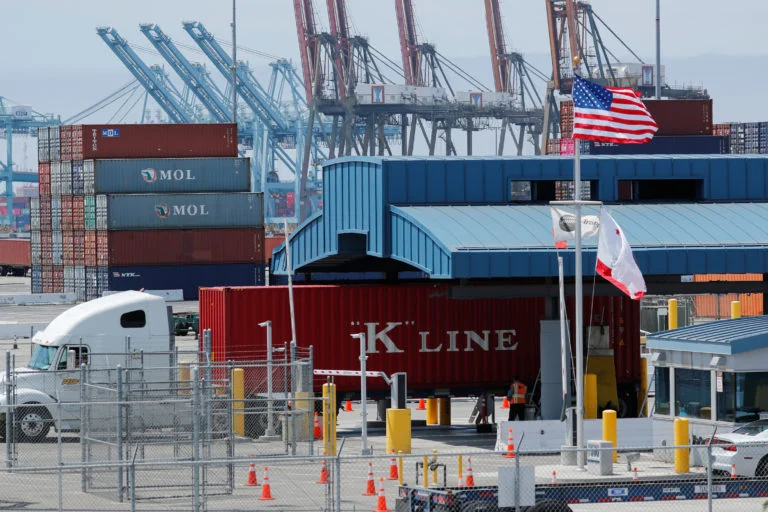
U.S. Trade Deficit Hits Record $131 Billion in January as Businesses Rush Imports Ahead of Tariffs
U.S. Trade Deficit Hits Record $131 Billion in January as Businesses Rush Imports Ahead of Tariffs.
RT
Ask Rio Times
17 years of Latin America reporting, on demand.
Open the full Ask Rio Times →

U.S. Sees Record-High Trade Deficit

The import surge reflects businesses’ efforts to avoid higher costs under tariffs imposed by President Donald Trump on key trading partners like Canada, Mexico, and China.

The LatAm Brief

One email, every weekday morning. What moved in Latin American markets, politics and expat life.

Yesterday’s subject line: “US avoids pledge to accept Brazil election result”

Free. We send a confirmation link first — nothing arrives until you click it. Unsubscribe with one click in any edition. If you stop opening us for 30 days we stop sending by ourselves, as we assume the interest is no longer there. See our privacy policy. We never share your email.

The new tariffs—25% on Canadian and Mexican imports and a doubled 20% rate on Chinese goods—prompted companies to front-load shipments before March deadlines. This reshaped trade flows in the short term.

This record-breaking deficit highlights how policy changes can influence market behavior and economic metrics. Imports subtract from GDP calculations, and January’s spike could weigh heavily on first-quarter growth estimates for 2025.

While gold imports accounted for much of the rise in industrial supplies and may not directly impact GDP, the overall surge underscores how businesses adapt to shifting trade policies and their potential ripple effects on supply chains and economic activity.

This article was produced by The Rio Times’ automated newsroom system. How we use AI · Report an error · Editorial responsibility: Matthias Camenzind, Editor-in-Chief

The Rio Times · Power Map
See who really holds power in Latin America
Click to open the Power Map →

Rotate for Best Experience

This report is optimized for landscape viewing. Rotate your phone for the full experience.