IBOV 180,767.74 ▲ 1.89% IPSA 11,315.26 ▼ 1.14% IPC MEX 65,314.78 ▼ 0.18% MERVAL 3,040,031 ▲ 0.20% COLCAP 2,473.24 ▲ 1.99% BVL PERÚ 59,450.29 ▲ 0.01% USD/BRL5.16▼ 0.54% USD/MXN16.99▼ 0.01% USD/CLP936.33▲ 0.22% USD/COP3,159▼ 1.31% USD/PEN3.36▼ 0.23% USD/ARS1,513▲ 0.25% USD/UYU40.24▲ 0.68% USD/PYG5,873▲ 0.47% USD/BOB12.08▲ 3.98% USD/DOP58.56▲ 0.38% USD/CRC446.47▲ 1.09% USD/GTQ7.62▲ 1.63% USD/HNL26.84▲ 1.11% USD/NIO36.62▲ 0.14% USD/VES796.33▼ 0.13% USD/PAB1.00— 0.00% USD/BZD2.00— 0.00% USD/JMD 157.28 — 0.00% USD/TTD6.69▼ 0.06% EUR/BRL5.97▼ 0.58% BRENT 88.88 ▼ 0.03% WTI 83.11 ▼ 0.11% IRON ORE 161.91 — — COPPER 6.61 ▲ 0.03% GOLD 4,461 ▲ 1.78% SILVER 65.59 ▲ 1.26% SOY 1,184 ▲ 3.20% CORN 480.50 ▲ 10.02% WHEAT 655.00 ▲ 3.93% COFFEE 317.25 ▼ 5.51% SUGAR 16.43 ▼ 1.79% ORANGE JUICE 138.55 ▼ 0.47% COTTON 85.03 ▲ 2.33% COCOA 5,719 ▲ 3.18% BEEF 223.60 ▼ 3.93% CATTLE 339.10 ▼ 3.16% LITHIUM 75.20 ▲ 1.47% PETR4 41.64 ▼ 0.05% VALE3 72.97 ▲ 0.83% ITUB4 38.60 ▼ 1.03% BBDC4 16.85 ▲ 0.36% ABEV3 14.89 ▼ 0.80% BBAS3 19.37 ▲ 0.47% B3SA3 14.26 ▼ 0.21% WEGE3 47.59 ▲ 0.49% PRIO3 59.14 ▼ 0.19% SUZB3 41.33 ▲ 2.35% RENT3 34.68 ▼ 0.09% AZZA3 15.89 ▼ 2.63% CSAN3 3.22 ▼ 1.83% RAIZ4 0.25 — 0.00% PCAR3 2.75 ▼ 0.36% GMAT3 3.65 ▼ 1.08% PSSA3 48.13 ▼ 0.54% CVCB3 1.33 ▼ 2.92% POSI3 3.36 ▲ 2.44% SLCE3 13.34 ▲ 0.30% NATU3 8.14 ▼ 0.73% IBOV 180,767.74 ▲ 1.89% IPSA 11,315.26 ▼ 1.14% IPC MEX 65,314.78 ▼ 0.18% MERVAL 3,040,031 ▲ 0.20% COLCAP 2,473.24 ▲ 1.99% BVL PERÚ 59,450.29 ▲ 0.01% USD/BRL 5.16 ▲ 0.01% USD/MXN 17.06 ▼ 0.24% USD/CLP 913.98 ▲ 0.04% USD/COP 3,140 ▲ 0.03% USD/PEN 3.36 ▼ 0.66% USD/ARS 1,493 ▲ 0.10% USD/UYU 40.27 ▲ 1.24% USD/PYG 5,939 ▲ 1.68% USD/BOB 11.64 ▼ 0.76% USD/DOP 58.34 ▲ 1.25% USD/CRC 445.92 ▲ 0.89% USD/GTQ 7.62 ▲ 2.21% USD/HNL 26.79 ▲ 1.57% USD/NIO 36.62 ▲ 0.69% USD/VES 762.44 ▼ 0.13% USD/PAB 1.00 — 0.00% USD/BZD 2.00 — 0.00% USD/JMD 157.28 — 0.00% USD/TTD 6.70 ▲ 0.61% EUR/BRL 5.95 ▲ 1.01% BRENT 88.88 ▼ 0.03% WTI 83.11 ▼ 0.11% IRON ORE 161.91 — — COPPER 6.61 ▲ 0.03% GOLD 4,461 ▲ 1.78% SILVER 65.59 ▲ 1.26% SOY 1,184 ▲ 3.20% CORN 480.50 ▲ 10.02% WHEAT 655.00 ▲ 3.93% COFFEE 317.25 ▼ 5.51% SUGAR 16.43 ▼ 1.79% ORANGE JUICE 138.55 ▼ 0.47% COTTON 85.03 ▲ 2.33% COCOA 5,719 ▲ 3.18% BEEF 223.60 ▼ 3.93% CATTLE 339.10 ▼ 3.16% LITHIUM 75.20 ▲ 1.47% PETR4 41.64 ▼ 0.05% VALE3 72.97 ▲ 0.83% ITUB4 38.60 ▼ 1.03% BBDC4 16.85 ▲ 0.36% ABEV3 14.89 ▼ 0.80% BBAS3 19.37 ▲ 0.47% B3SA3 14.26 ▼ 0.21% WEGE3 47.59 ▲ 0.49% PRIO3 59.14 ▼ 0.19% SUZB3 41.33 ▲ 2.35% RENT3 34.68 ▼ 0.09% AZZA3 15.89 ▼ 2.63% CSAN3 3.22 ▼ 1.83% RAIZ4 0.25 — 0.00% PCAR3 2.75 ▼ 0.36% GMAT3 3.65 ▼ 1.08% PSSA3 48.13 ▼ 0.54% CVCB3 1.33 ▼ 2.92% POSI3 3.36 ▲ 2.44% SLCE3 13.34 ▲ 0.30% NATU3 8.14 ▼ 0.73%
since 2009
Tuesday, September 1, 2026

Agri Business Business - Brazil

U.S. Corn Exports: A Snapshot of the 2023/24 Season

By · April 11, 2024 · 2 min read

Daily Brief

The morning intel from across Latin America. Free.

By subscribing you agree to our privacy policy. We never share your email.

In the 2023–24 season, U.S. corn exports experienced a notable dip, with sales totaling just 325,500 metric tons for the week ending April 4, according to USDA reports.

This represented a significant decline, with a 66% drop from the previous week and a 72% decrease compared to the average of the previous four weeks.

The major importers during this period were Japan, Mexico, South Korea, China, and Venezuela, although there were some cancellations from undisclosed locations.

Additionally, the U.S. recorded sales for the 2024–25 season totaling 9,500 metric tons, predominantly to Nicaragua and Honduras.

However, these figures fell well below analyst expectations, which had anticipated sales ranging between 750,000 and 1.3 million metric tons.
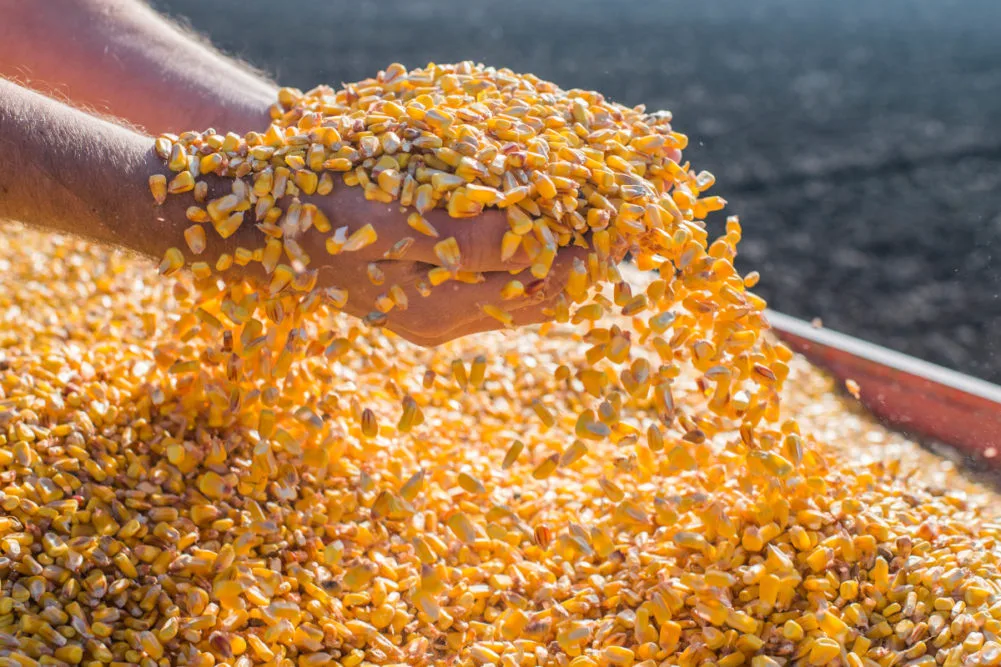
U.S. Corn Exports: A Snapshot of the 2023/24 Season
U.S. Corn Exports: A Snapshot of the 2023/24 Season. (Photo Internet reproduction)
One-stop reference
Company Intelligence
Every listed company in Latin America — financials, ownership and structure for 1,450+ companies across 26 exchanges, in one place.
Browse the directory →
RT
Ask Rio Times
Latin American markets, currencies and companies.
Open the full Ask Rio Times →

Despite lower sales, corn exports reached 1.557 million metric tons, slightly down weekly but up 10% over the four-week average.

The leading destinations for these shipments included Mexico, Japan, South Korea, Taiwan, and China.

Sales dip underscores U.S. corn export market volatility shaped by global demand, pricing competition, and geopolitical factors.

US maintains pivotal role in global agricultural trade, adept at adapting to market shifts, retaining position as top corn supplier.

The current season’s challenges underscore the complexities of navigating international trade, where diplomatic relationships and trade policies play crucial roles.

Understanding trends crucial for agricultural stakeholders, guiding adaptation strategies in a dynamic global marketplace for farmers and investors.

Swift response to market dynamics and demand forecasting vital for maintaining competitiveness in the pivotal U.S. agricultural sector.

This article was produced by The Rio Times’ automated newsroom system. How we use AI · Report an error

Read More from The Rio Times

The Rio Times · Power Map
See who really holds power in Latin America
Click to open the Power Map

Rotate for Best Experience

This report is optimized for landscape viewing. Rotate your phone for the full experience.