IBOV 177,599.57 ▲ 1.10% IPSA 11,335.31 ▼ 0.97% IPC MEX 65,048.39 ▼ 0.67% MERVAL 3,052,917 ▲ 2.47% COLCAP 2,476.26 ▲ 0.75% BVL PERÚ 59,928.30 ▲ 0.07% USD/BRL5.18▼ 0.25% USD/MXN16.99▼ 0.28% USD/CLP934.20▲ 0.29% USD/COP3,205▲ 0.16% USD/PEN3.36▲ 0.38% USD/ARS1,509▼ 0.28% USD/UYU40.29▲ 0.05% USD/PYG5,892▼ 0.13% USD/BOB11.84▲ 0.51% USD/DOP58.64▲ 0.05% USD/CRC446.47▼ 0.04% USD/GTQ7.62▼ 0.02% USD/HNL26.84— 0.00% USD/NIO36.62— 0.00% USD/VES793.00▼ 0.13% USD/PAB1.00— 0.00% USD/BZD2.00— 0.00% USD/JMD 157.28 — 0.00% USD/TTD6.69▼ 0.37% EUR/BRL6.02▼ 0.14% BRENT 88.88 ▼ 0.03% WTI 83.11 ▼ 0.11% IRON ORE 161.91 — — COPPER 6.61 ▲ 0.03% GOLD 4,461 ▲ 1.78% SILVER 65.59 ▲ 1.26% SOY 1,184 ▲ 3.20% CORN 480.50 ▲ 10.02% WHEAT 655.00 ▲ 3.93% COFFEE 317.25 ▼ 5.51% SUGAR 16.43 ▼ 1.79% ORANGE JUICE 138.55 ▼ 0.47% COTTON 85.03 ▲ 2.33% COCOA 5,719 ▲ 3.18% BEEF 223.60 ▼ 3.93% CATTLE 339.10 ▼ 3.16% LITHIUM 75.20 ▲ 1.47% PETR4 41.64 ▼ 0.05% VALE3 72.97 ▲ 0.83% ITUB4 38.60 ▼ 1.03% BBDC4 16.85 ▲ 0.36% ABEV3 14.89 ▼ 0.80% BBAS3 19.37 ▲ 0.47% B3SA3 14.26 ▼ 0.21% WEGE3 47.59 ▲ 0.49% PRIO3 59.14 ▼ 0.19% SUZB3 41.33 ▲ 2.35% RENT3 34.68 ▼ 0.09% AZZA3 15.89 ▼ 2.63% CSAN3 3.22 ▼ 1.83% RAIZ4 0.25 — 0.00% PCAR3 2.75 ▼ 0.36% GMAT3 3.65 ▼ 1.08% PSSA3 48.13 ▼ 0.54% CVCB3 1.33 ▼ 2.92% POSI3 3.36 ▲ 2.44% SLCE3 13.34 ▲ 0.30% NATU3 8.14 ▼ 0.73% IBOV 177,599.57 ▲ 1.10% IPSA 11,335.31 ▼ 0.97% IPC MEX 65,048.39 ▼ 0.67% MERVAL 3,052,917 ▲ 2.47% COLCAP 2,476.26 ▲ 0.75% BVL PERÚ 59,928.30 ▲ 0.07% USD/BRL 5.16 ▲ 0.01% USD/MXN 17.06 ▼ 0.24% USD/CLP 913.98 ▲ 0.04% USD/COP 3,140 ▲ 0.03% USD/PEN 3.36 ▼ 0.66% USD/ARS 1,493 ▲ 0.10% USD/UYU 40.27 ▲ 1.24% USD/PYG 5,939 ▲ 1.68% USD/BOB 11.64 ▼ 0.76% USD/DOP 58.34 ▲ 1.25% USD/CRC 445.92 ▲ 0.89% USD/GTQ 7.62 ▲ 2.21% USD/HNL 26.79 ▲ 1.57% USD/NIO 36.62 ▲ 0.69% USD/VES 762.44 ▼ 0.13% USD/PAB 1.00 — 0.00% USD/BZD 2.00 — 0.00% USD/JMD 157.28 — 0.00% USD/TTD 6.70 ▲ 0.61% EUR/BRL 5.95 ▲ 1.01% BRENT 88.88 ▼ 0.03% WTI 83.11 ▼ 0.11% IRON ORE 161.91 — — COPPER 6.61 ▲ 0.03% GOLD 4,461 ▲ 1.78% SILVER 65.59 ▲ 1.26% SOY 1,184 ▲ 3.20% CORN 480.50 ▲ 10.02% WHEAT 655.00 ▲ 3.93% COFFEE 317.25 ▼ 5.51% SUGAR 16.43 ▼ 1.79% ORANGE JUICE 138.55 ▼ 0.47% COTTON 85.03 ▲ 2.33% COCOA 5,719 ▲ 3.18% BEEF 223.60 ▼ 3.93% CATTLE 339.10 ▼ 3.16% LITHIUM 75.20 ▲ 1.47% PETR4 41.64 ▼ 0.05% VALE3 72.97 ▲ 0.83% ITUB4 38.60 ▼ 1.03% BBDC4 16.85 ▲ 0.36% ABEV3 14.89 ▼ 0.80% BBAS3 19.37 ▲ 0.47% B3SA3 14.26 ▼ 0.21% WEGE3 47.59 ▲ 0.49% PRIO3 59.14 ▼ 0.19% SUZB3 41.33 ▲ 2.35% RENT3 34.68 ▼ 0.09% AZZA3 15.89 ▼ 2.63% CSAN3 3.22 ▼ 1.83% RAIZ4 0.25 — 0.00% PCAR3 2.75 ▼ 0.36% GMAT3 3.65 ▼ 1.08% PSSA3 48.13 ▼ 0.54% CVCB3 1.33 ▼ 2.92% POSI3 3.36 ▲ 2.44% SLCE3 13.34 ▲ 0.30% NATU3 8.14 ▼ 0.73%
since 2009
Monday, August 31, 2026

Peru’s Exports Surge 22% in 2025, Driven by Mining and Processed Goods

By · July 4, 2025 · 2 min read

Daily Brief

The morning intel from across Latin America. Free.

By subscribing you agree to our privacy policy. We never share your email.

Peru’s exports grew by 22.3 percent in the first five months of 2025, reaching $33.41 billion, according to the Association of Exporters (ADEX) using official data.

Most of this growth came from traditional exports like minerals, which made up 74 percent of the total, or $24.72 billion. Mining led the way, earning $21.7 billion, thanks to strong sales of copper and gold.

Hydrocarbons and traditional fishing also grew, with fishing exports up more than 50 percent. However, traditional farm exports dropped by 12.3 percent.

Non-traditional, or value-added, exports also performed well, rising 23.5 percent to $8.69 billion. Sectors like agroindustry, chemicals, and processed fish saw big gains, with agroindustry up 26.2 percent and processed fish up 67.3 percent.

Other sectors such as clothing, metalworking, textiles, and jewelry also grew. Only non-metallic mining, wood, and miscellaneous goods like paper and leather declined.
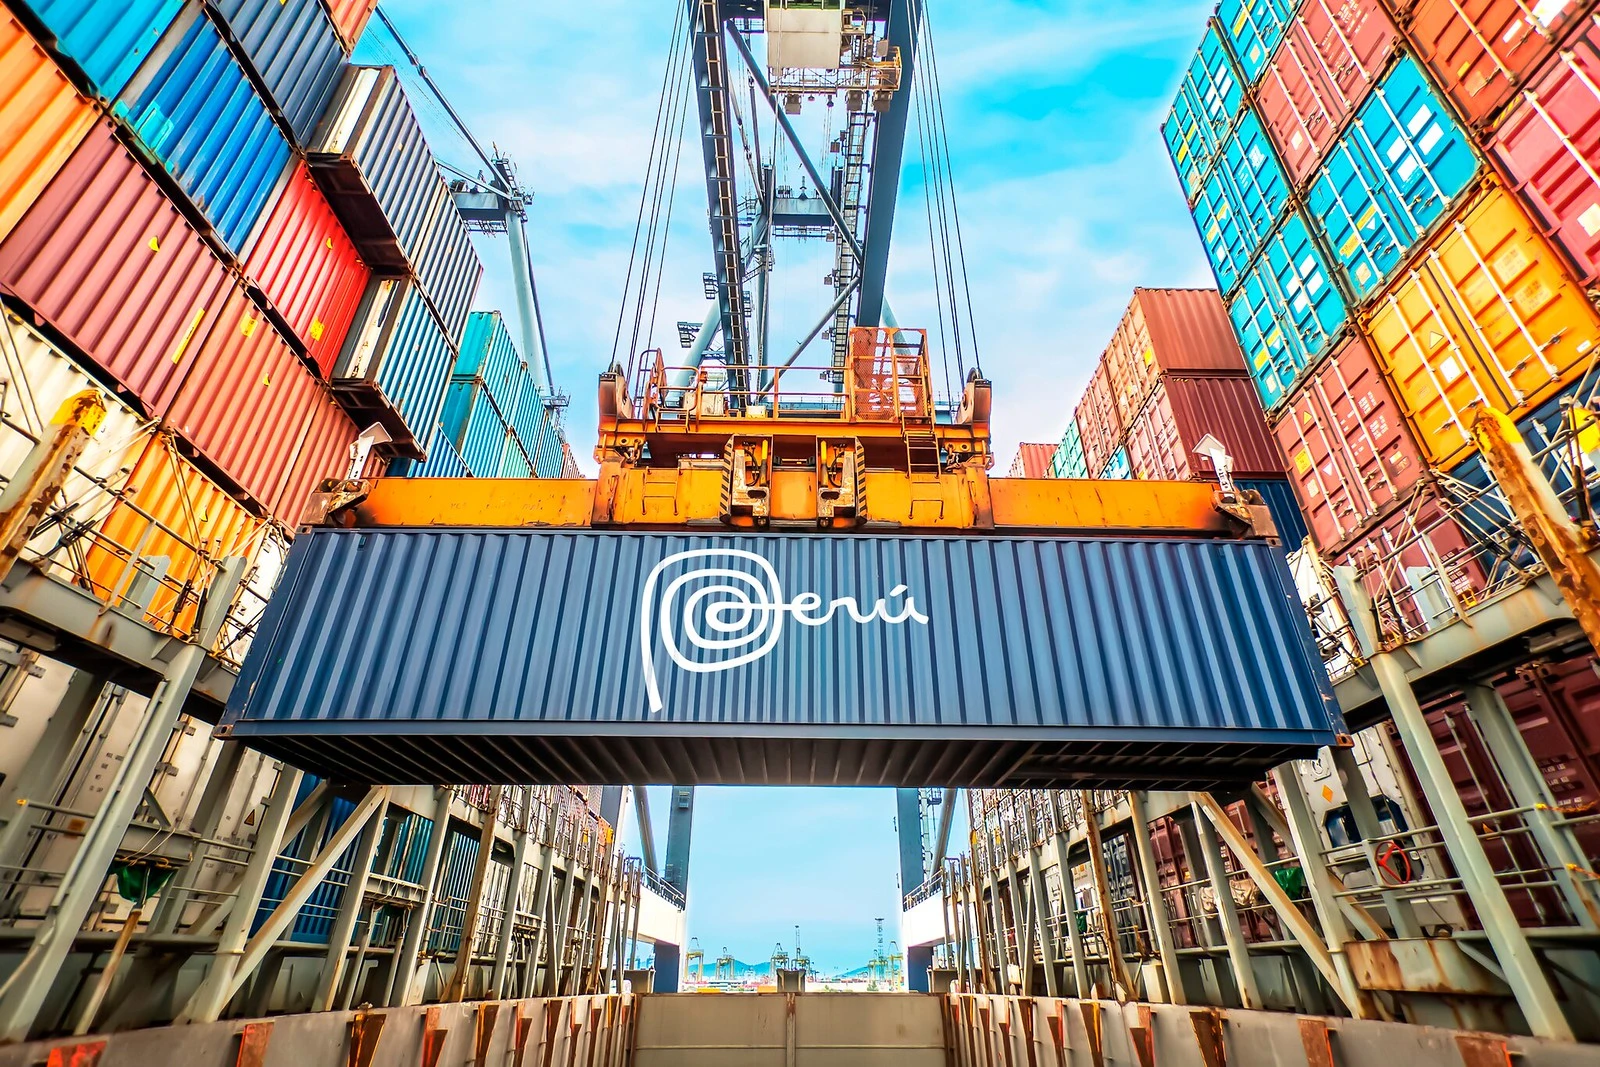
Peru’s Exports Surge 22% in 2025, Driven by Mining and Processed Goods
Peru’s Exports Surge 22% in 2025, Driven by Mining and Processed Goods. (Photo Internet reproduction)
One-stop reference
Company Intelligence
Every listed company in Latin America — financials, ownership and structure for 1,450+ companies across 26 exchanges, in one place.
Browse the directory →
RT
Ask Rio Times
17 years of Latin America reporting, on demand.
Open the full Ask Rio Times →

Most exports—74.4 percent—left Peru by sea, while 22.1 percent went by air and 3.2 percent by land. The numbers show that Peru’s export growth relies on both its mineral resources and a rising share of processed and manufactured goods.

While mining remains the backbone, value-added exports are gaining ground. Some sectors, like traditional farming and wood, struggled. Still, Peru’s exporters have shown they can adapt, focusing on what the global market demands and using strong logistics to reach buyers.

The data highlights Peru’s ability to grow exports by balancing raw materials with more finished products, keeping its trade strong in a changing world.

This article was produced by The Rio Times’ automated newsroom system. How we use AI · Report an error

Read More from The Rio Times

The Rio Times · Power Map
See who really holds power in Latin America
Click to open the Power Map

Rotate for Best Experience

This report is optimized for landscape viewing. Rotate your phone for the full experience.