Corn Fund Falls 1.00% as Soybeans Edge Up | Grains Wrap, Nov 20
Corn closed near its 12-month low on steady selling and a large Brazilian crop forecast, while soybeans edged up and wheat slipped.
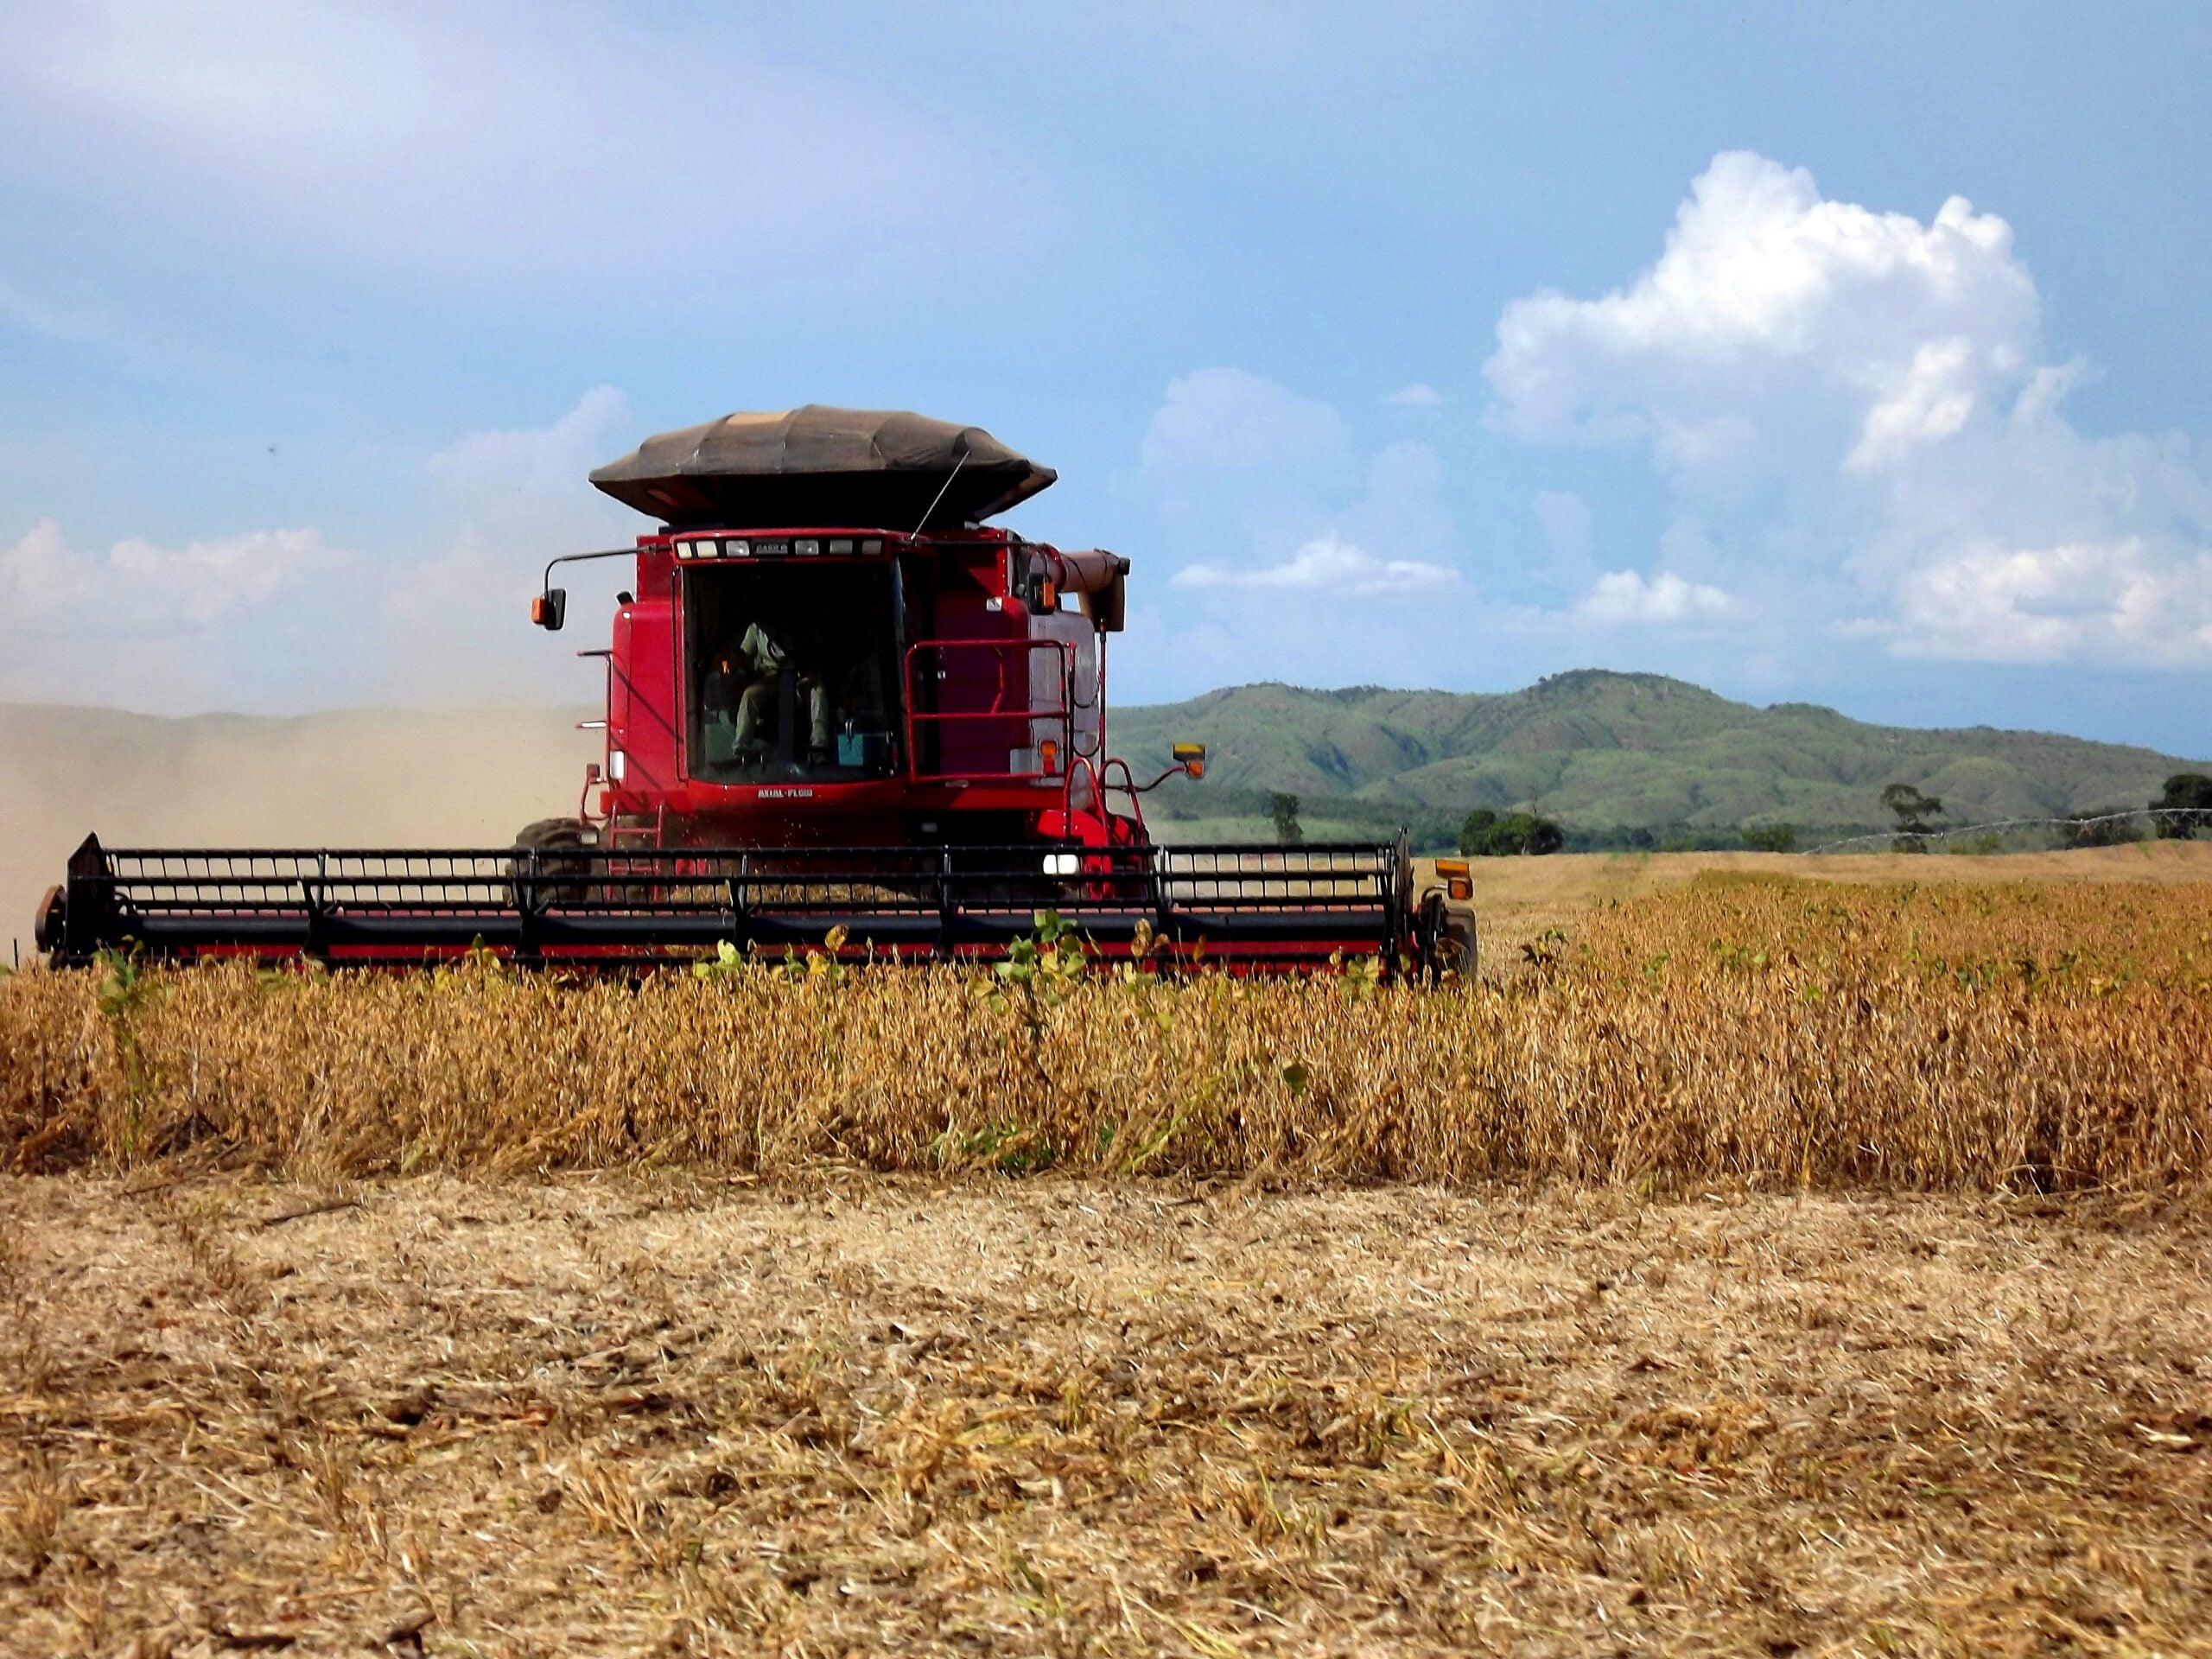
Key Facts
- The corn fund CORN fell 1.00% to US$16.90, only 2.6% above its 12-month low of 16.47.
- The soybean fund SOYB rose 0.51% to US$25.57, a small bounce after four weeks of drift.
- The wheat fund WEAT fell 0.14% to US$21.44 and is 23.4% below its 28 August high.
- Grains mostly shrugged off the rout: the S&P 500 fell 3.70% and the VIX fear gauge jumped 26.20%.
Today’s Focus
Corn closed Friday, November 20, 2026 at its lowest in months, with the corn-tracking fund US$16.90 and only 2.6% above its 12-month low of 16.47 from 29 June. Soybeans edged up while wheat slipped.
The main cause is supply. Brazil’s crop agency forecasts a large harvest, and corn has fallen steadily for weeks.
The unusual part is what did not happen. Shares plunged and gold fell sharply, yet grains were not swept up in the panic.
What matters today. Corn is testing its year’s floor while soybeans resist, so the next move depends on whether Brazil’s harvest and China’s buying keep soybeans afloat.
01 The session in one read
Think of the grain market as a three-lane road. On Friday, November 20, 2026, soybeans crept forward, wheat idled and corn went backwards.
Corn is the story. The corn fund slipped again and ended close to its year’s floor, after losing 14.6% over 60 sessions.
Grains are falling on their own fundamentals, not on the stock-market rout: big supply explains corn, while soybeans held up on their own. The variable to watch is whether corn breaks below its 16.47 low from 29 June.
02 The board
The soybean-tracking fund rose 0.51% to US$25.57, while the corn fund lost -1.00% to US$16.90. The wheat fund eased 0.14% to US$21.44.
These are exchange-traded funds that follow futures prices, so they mirror the direction of the grains rather than the raw price in the field.
| Asset | Level | Change |
|---|---|---|
| Soybeans (SOYB) | US$25.57 | +0.51% |
| Corn (CORN) | US$16.90 | -1.00% |
| Wheat (WEAT) | US$21.44 | -0.14% |
Source: RT close, 2026-11-20. Where a commodity has no spot feed, an exchange-traded tracker or leading producer is shown as a labelled proxy.
Live Market IntelligenceThe live market board
Rio Times · Live Market Intelligence
Latin America — Cross-Market Board
| Instrument | Last | Change | YoY | Prev. | High | Low | Volume |
|---|---|---|---|---|---|---|---|
| IBOV | 166,376.43 | -0.69% | +7.08% | 167,537.95 | 168,498 | 165,833 | — |
| IPSA | 10,350.51 | +0.16% | — | 10,333.77 | 10,351 | 10,249 | — |
| IPC MEX | 68,456.71 | -0.37% | +11.28% | 68,713.60 | 69,253 | 68,306 | 201,576,684 |
| MERVAL | 2,848,945 | — | — | 2,848,945 | — | — | — |
| COLCAP | 2,452.46 | — | — | — | — | — | — |
| USD/BRL | 5.95 | +0.24% | +11.64% | 5.93 | 5.95 | 5.90 | — |
| EUR/BRL | 6.52 | +1.12% | +6.14% | 6.45 | 6.54 | 6.49 | — |
| USD/MXN | 19.14 | +0.30% | +4.51% | 19.09 | 19.20 | 18.95 | — |
| USD/CLP | 1,022 | +0.52% | +9.67% | 1,017 | 1,023 | 1,012 | — |
| USD/COP | 3,483 | +3.77% | -6.17% | 3,357 | 3,508 | 3,404 | — |
| USD/PEN | 3.45 | +0.19% | +2.23% | 3.45 | 3.46 | 3.43 | — |
| USD/ARS | 1,580 | +0.93% | +12.26% | 1,565 | 1,580 | 1,562 | — |
| USD/UYU | 40.61 | +3.16% | +3.31% | 39.36 | 40.61 | 40.61 | — |
| USD/PYG | 6,212 | +2.34% | -10.37% | 6,070 | 6,212 | 6,212 | — |
| USD/BOB | 11.64 | +2.55% | +72.76% | 11.35 | 11.64 | 11.64 | — |
| USD/DOP | 59.52 | -0.80% | -5.52% | 60.00 | 60.00 | 59.47 | — |
| USD/CRC | 441.73 | +2.68% | -9.50% | 430.21 | 441.73 | 441.73 | — |
| USD/GTQ | 7.64 | +3.22% | +2.03% | 7.40 | 7.64 | 7.64 | — |
03 Why it moved
Cause one, with fairly high confidence, is persistent selling in corn: the fund had already lost 14.6% over 60 sessions.
Cause two, with medium confidence, is supply.
The signals conflict with the wider market. The S&P 500 fell 3.70%, the VIX rose 26.20% and the gold fund dropped 3.67%, which looks like investors selling whatever they could, yet the dollar index barely moved at 103.84 and the 10-year Treasury yield fell 10 basis points to 4.94%.
The US Department of Agriculture’s November report cut its American corn crop forecast by 3.57 million tonnes to 403.7 million tonnes. That has not been enough to lift prices, which tells us the market is looking beyond the US harvest to Brazil.
04 The trend behind it
Soybeans are 9.1% below their 10 September high of 28.14 and 17.8% above the January low of 21.71, after losing 4.55% over 20 sessions. Corn lost 4.41% over the same stretch, and wheat lost 6.09%.
This is a continuation, not a new phase. Wheat has lost 21.2% in 60 sessions, the steepest slide of the three.
Our own price history offers a guide, not a forecast. After earlier falls of this size, soybeans were higher 20 sessions later in 38 of 62 cases (61%), with a median gain of 0.7% and a worst case of 10.1% lower.
Corn rose in only 40 of 84 comparable cases (48%), with a median change of 0.1% lower and a worst case of 12.2% lower. Wheat rose in just 28 of 74 (38%), with a median of 0.7% lower and a worst case of 23.9% lower.
05 What it means for Latin America
Brazil and Argentina feed the world, so cheaper grain squeezes their farmers’ dollar incomes. Brazil’s soybean area is 49.3 million hectares, so even small price moves matter across the interior.
Cheaper corn helps Brazilian pork and poultry producers, whose largest cost is feed. It also helps importers such as Mexico, the region’s big corn buyer.
06 The names to watch
Watch the three funds on the board: the soybean fund (SOYB), corn fund (CORN) and wheat fund (WEAT). Conab and the US Department of Agriculture publish the crop figures that move them.
Brazilian grain handlers and meatpackers are most exposed. A fall in feed costs usually helps the latter and trims the former.
07 What would end it
The line in the sand for corn is the 16.47 low of 29 June, now just 2.6% away. A close below it would invite more selling, while a bounce toward 20.29, the 1 September peak, would need a clear supply shock.
Soybeans have support at 25 and resistance near the 28.14 September high. Next catalysts are the USDA’s December supply report and Conab’s next crop survey, along with any Chinese purchase announcements. The honest answer is that this slide stops only when sellers tire or Brazil’s weather turns.
08 What to watch
- Corn floor: A close below the 12-month low of 16.47 would signal further trouble.
- China buying: Any large soybean purchase from Brazil or the US would lift prices.
- Brazil weather: Conab’s next survey will show whether the crop estimate holds.
- Corn’s slide: If the fund stops making new lows, corn may stabilise.
More: Latin America news in English, every day from The Rio Times.
Frequently Asked Questions
Why did corn fall on Friday, November 20, 2026?
A large Brazilian crop forecast and weeks of steady selling pushed corn to a multi-month low.
Why did soybeans rise?
Soybeans held up while corn and wheat slipped; the soybean fund rose 0.51%.
Does the stock-market fall explain grains?
Only partly. Grains barely reacted to the S&P 500’s 3.70% fall, so their own supply matters more.
Is this a buying signal?
Not necessarily. History shows corn rose 20 sessions later only 48% of the time after similar falls, and history is not a forecast.
Market data: The Rio Times
This article was produced by The Rio Times’ automated AI newsroom. Editorial responsibility: Matthias Camenzind, Publisher and Editor-in-Chief. The Rio Times also runs Ask Rio Times, which answers from 100,000+ of our own articles, the daily Latin America Power Map, and prediction-market odds on elections and markets.. How we use AI · Report an error
LatAm Markets: Live Signals → — real-time movers, turnover leaders and FX across Latin America.