IBOV 205,469.80 ▼ 0.18% IPSA 10,990.43 ▼ 1.56% IPC MEX 65,312.46 ▲ 0.52% MERVAL 2,844,771 ▼ 1.80% COLCAP 2,554.86 ▼ 1.32% BVL PERÚ 60,766.81 ▼ 1.47% USD/BRL5.01▲ 0.49% USD/MXN17.97▼ 0.09% USD/CLP977.49▲ 0.49% USD/COP3,239▲ 0.97% USD/PEN3.44▼ 0.05% USD/ARS1,517▼ 0.24% USD/UYU40.09▲ 2.39% USD/PYG5,835▲ 3.05% USD/BOB11.87▲ 2.15% USD/DOP60.39▲ 3.87% USD/CRC453.46▲ 2.32% USD/GTQ7.64▲ 3.39% USD/HNL26.86▲ 0.86% USD/NIO36.62▲ 0.26% USD/VES871.68▼ 0.13% USD/PAB1.00— 0.00% USD/BZD2.00— 0.00% USD/JMD 157.28 — 0.00% USD/TTD6.70▲ 2.23% EUR/BRL5.61— 0.00% BRENT 88.88 ▼ 0.03% WTI 83.11 ▼ 0.11% IRON ORE 161.91 — — COPPER 6.61 ▲ 0.03% GOLD 4,461 ▲ 1.78% SILVER 65.59 ▲ 1.26% SOY 1,184 ▲ 3.20% CORN 480.50 ▲ 10.02% WHEAT 655.00 ▲ 3.93% COFFEE 317.25 ▼ 5.51% SUGAR 16.43 ▼ 1.79% ORANGE JUICE 138.55 ▼ 0.47% COTTON 85.03 ▲ 2.33% COCOA 5,719 ▲ 3.18% BEEF 223.60 ▼ 3.93% CATTLE 339.10 ▼ 3.16% LITHIUM 75.20 ▲ 1.47% PETR4 41.64 ▼ 0.05% VALE3 72.97 ▲ 0.83% ITUB4 38.60 ▼ 1.03% BBDC4 16.85 ▲ 0.36% ABEV3 14.89 ▼ 0.80% BBAS3 19.37 ▲ 0.47% B3SA3 14.26 ▼ 0.21% WEGE3 47.59 ▲ 0.49% PRIO3 59.14 ▼ 0.19% SUZB3 41.33 ▲ 2.35% RENT3 34.68 ▼ 0.09% AZZA3 15.89 ▼ 2.63% CSAN3 3.22 ▼ 1.83% RAIZ4 0.25 — 0.00% PCAR3 2.75 ▼ 0.36% GMAT3 3.65 ▼ 1.08% PSSA3 48.13 ▼ 0.54% CVCB3 1.33 ▼ 2.92% POSI3 3.36 ▲ 2.44% SLCE3 13.34 ▲ 0.30% NATU3 8.14 ▼ 0.73% IBOV 205,469.80 ▼ 0.18% IPSA 10,990.43 ▼ 1.56% IPC MEX 65,312.46 ▲ 0.52% MERVAL 2,844,771 ▼ 1.80% COLCAP 2,554.86 ▼ 1.32% BVL PERÚ 60,766.81 ▼ 1.47% USD/BRL 5.16 ▲ 0.01% USD/MXN 17.06 ▼ 0.24% USD/CLP 913.98 ▲ 0.04% USD/COP 3,140 ▲ 0.03% USD/PEN 3.36 ▼ 0.66% USD/ARS 1,493 ▲ 0.10% USD/UYU 40.27 ▲ 1.24% USD/PYG 5,939 ▲ 1.68% USD/BOB 11.64 ▼ 0.76% USD/DOP 58.34 ▲ 1.25% USD/CRC 445.92 ▲ 0.89% USD/GTQ 7.62 ▲ 2.21% USD/HNL 26.79 ▲ 1.57% USD/NIO 36.62 ▲ 0.69% USD/VES 762.44 ▼ 0.13% USD/PAB 1.00 — 0.00% USD/BZD 2.00 — 0.00% USD/JMD 157.28 — 0.00% USD/TTD 6.70 ▲ 0.61% EUR/BRL 5.95 ▲ 1.01% BRENT 88.88 ▼ 0.03% WTI 83.11 ▼ 0.11% IRON ORE 161.91 — — COPPER 6.61 ▲ 0.03% GOLD 4,461 ▲ 1.78% SILVER 65.59 ▲ 1.26% SOY 1,184 ▲ 3.20% CORN 480.50 ▲ 10.02% WHEAT 655.00 ▲ 3.93% COFFEE 317.25 ▼ 5.51% SUGAR 16.43 ▼ 1.79% ORANGE JUICE 138.55 ▼ 0.47% COTTON 85.03 ▲ 2.33% COCOA 5,719 ▲ 3.18% BEEF 223.60 ▼ 3.93% CATTLE 339.10 ▼ 3.16% LITHIUM 75.20 ▲ 1.47% PETR4 41.64 ▼ 0.05% VALE3 72.97 ▲ 0.83% ITUB4 38.60 ▼ 1.03% BBDC4 16.85 ▲ 0.36% ABEV3 14.89 ▼ 0.80% BBAS3 19.37 ▲ 0.47% B3SA3 14.26 ▼ 0.21% WEGE3 47.59 ▲ 0.49% PRIO3 59.14 ▼ 0.19% SUZB3 41.33 ▲ 2.35% RENT3 34.68 ▼ 0.09% AZZA3 15.89 ▼ 2.63% CSAN3 3.22 ▼ 1.83% RAIZ4 0.25 — 0.00% PCAR3 2.75 ▼ 0.36% GMAT3 3.65 ▼ 1.08% PSSA3 48.13 ▼ 0.54% CVCB3 1.33 ▼ 2.92% POSI3 3.36 ▲ 2.44% SLCE3 13.34 ▲ 0.30% NATU3 8.14 ▼ 0.73%
since 2009
Wednesday, October 7, 2026

World-News North America

U.S. Producer Prices Show Modest Growth in May, Easing Inflation Concerns

By · June 12, 2025 · 2 min read

The U.S. Bureau of Labor Statistics released new figures this week showing that producer prices in May rose less than expected, easing concerns about inflation for businesses and consumers.

The Producer Price Index (PPI), which measures the average change in prices received by domestic producers for their output, increased by just 0.1 percent from April to May. Over the past year, the PPI rose by 2.6 percent.

The core PPI, which excludes the often-volatile food and energy categories, climbed 3.0 percent year-over-year. Both numbers came in below most forecasts, signaling that inflation at the wholesale level is not accelerating.

Goods prices increased by 0.2 percent in May. The largest contributors were tobacco, gasoline, and poultry, while jet fuel prices dropped sharply. The services sector, which includes everything from transportation to retail margins, saw a modest 0.1 percent increase.

Notably, the price of unprocessed goods, especially natural gas, fell significantly, which helped offset other increases. This drop in input costs for many manufacturers and service providers played a key role in keeping overall inflation in check.
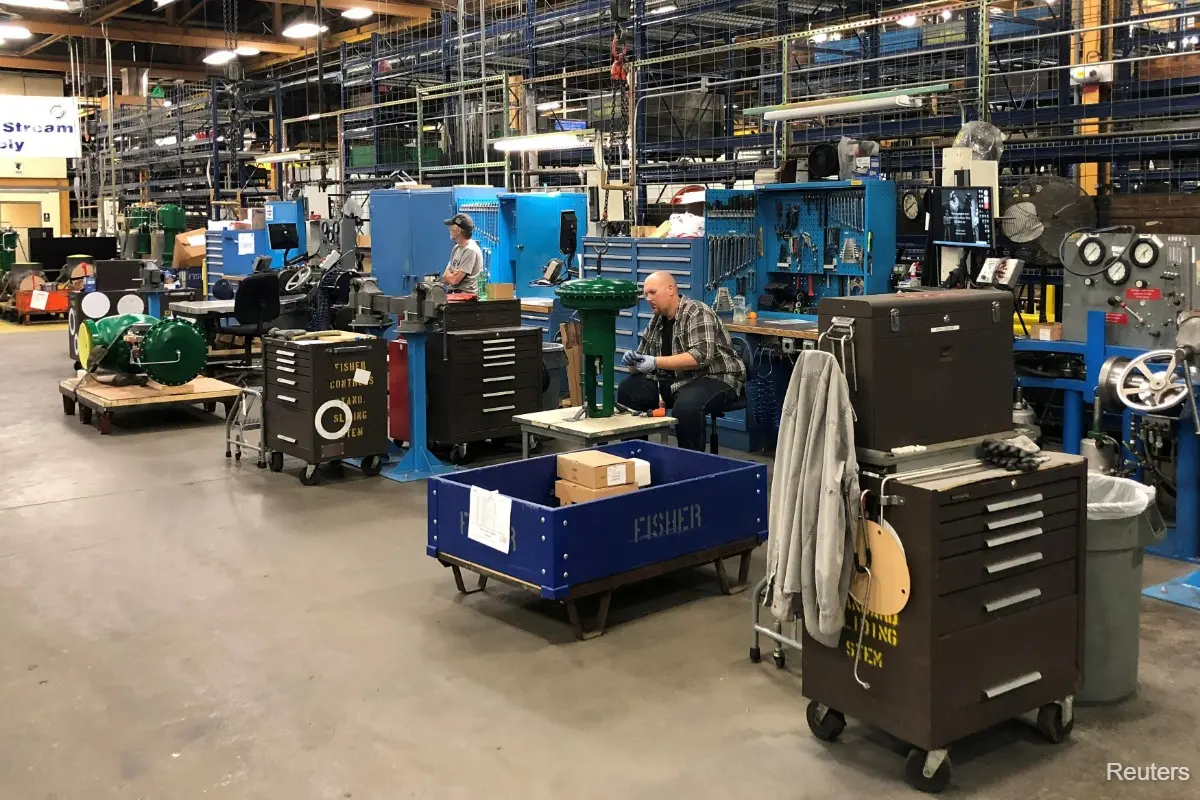
U.S. Producer Prices Show Modest Growth in May, Easing Inflation Concerns
U.S. Producer Prices Show Modest Growth in May, Easing Inflation Concerns.
RT
Ask Rio Times
Latin American markets, currencies and companies.
Open the full Ask Rio Times →

Slower U.S. Producer Price Growth Eases Inflation Fears

These figures matter because the PPI often serves as an early warning signal for future consumer price changes. When producer prices rise quickly, companies may pass those higher costs on to shoppers.

The LatAm Brief

One email, every weekday morning. What moved in Latin American markets, politics and expat life.

Yesterday’s subject line: “Mexico sells record US$60.6bn to the US in August”

Free. We send a confirmation link first — nothing arrives until you click it. Unsubscribe with one click in any edition. If you stop opening us for 30 days we stop sending by ourselves, as we assume the interest is no longer there. See our privacy policy. We never share your email.

In this case, the slower growth in producer prices suggests that businesses face less pressure to raise prices for consumers in the coming months. The data also comes at a time when the Federal Reserve is closely watching inflation trends to decide on interest rate policy.

Lower-than-expected producer price growth could influence the central bank to hold off on raising rates further, which would affect borrowing costs for businesses and households.

This is especially important for companies managing tight margins and for families concerned about the cost of goods and services. In summary, the latest official data from the Bureau of Labor Statistics indicates that U.S. producer prices are rising at a slower pace than many expected.

This development offers some relief to businesses and consumers worried about inflation. The figures provide a clear, fact-based snapshot of the current economic landscape, free from speculation or bias.

This article was produced by The Rio Times’ automated newsroom system. How we use AI · Report an error · Editorial responsibility: Matthias Camenzind, Editor-in-Chief

The Rio Times · Power Map
See who really holds power in Latin America
Click to open the Power Map →

Rotate for Best Experience

This report is optimized for landscape viewing. Rotate your phone for the full experience.