IBOV 205,469.80 ▼ 0.18% IPSA 10,990.43 ▼ 1.56% IPC MEX 65,312.46 ▲ 0.52% MERVAL 2,844,771 ▼ 1.80% COLCAP 2,554.86 ▼ 1.32% BVL PERÚ 60,766.81 ▼ 1.47% USD/BRL5.01▲ 0.49% USD/MXN17.97▼ 0.09% USD/CLP977.49▲ 0.49% USD/COP3,239▲ 0.97% USD/PEN3.44▼ 0.05% USD/ARS1,517▼ 0.24% USD/UYU40.09▲ 2.39% USD/PYG5,835▲ 3.05% USD/BOB11.87▲ 2.15% USD/DOP60.39▲ 3.87% USD/CRC453.46▲ 2.32% USD/GTQ7.64▲ 3.39% USD/HNL26.86▲ 0.86% USD/NIO36.62▲ 0.26% USD/VES871.68▼ 0.13% USD/PAB1.00— 0.00% USD/BZD2.00— 0.00% USD/JMD 157.28 — 0.00% USD/TTD6.70▲ 2.23% EUR/BRL5.61— 0.00% BRENT 88.88 ▼ 0.03% WTI 83.11 ▼ 0.11% IRON ORE 161.91 — — COPPER 6.61 ▲ 0.03% GOLD 4,461 ▲ 1.78% SILVER 65.59 ▲ 1.26% SOY 1,184 ▲ 3.20% CORN 480.50 ▲ 10.02% WHEAT 655.00 ▲ 3.93% COFFEE 317.25 ▼ 5.51% SUGAR 16.43 ▼ 1.79% ORANGE JUICE 138.55 ▼ 0.47% COTTON 85.03 ▲ 2.33% COCOA 5,719 ▲ 3.18% BEEF 223.60 ▼ 3.93% CATTLE 339.10 ▼ 3.16% LITHIUM 75.20 ▲ 1.47% PETR4 41.64 ▼ 0.05% VALE3 72.97 ▲ 0.83% ITUB4 38.60 ▼ 1.03% BBDC4 16.85 ▲ 0.36% ABEV3 14.89 ▼ 0.80% BBAS3 19.37 ▲ 0.47% B3SA3 14.26 ▼ 0.21% WEGE3 47.59 ▲ 0.49% PRIO3 59.14 ▼ 0.19% SUZB3 41.33 ▲ 2.35% RENT3 34.68 ▼ 0.09% AZZA3 15.89 ▼ 2.63% CSAN3 3.22 ▼ 1.83% RAIZ4 0.25 — 0.00% PCAR3 2.75 ▼ 0.36% GMAT3 3.65 ▼ 1.08% PSSA3 48.13 ▼ 0.54% CVCB3 1.33 ▼ 2.92% POSI3 3.36 ▲ 2.44% SLCE3 13.34 ▲ 0.30% NATU3 8.14 ▼ 0.73% IBOV 205,469.80 ▼ 0.18% IPSA 10,990.43 ▼ 1.56% IPC MEX 65,312.46 ▲ 0.52% MERVAL 2,844,771 ▼ 1.80% COLCAP 2,554.86 ▼ 1.32% BVL PERÚ 60,766.81 ▼ 1.47% USD/BRL 5.16 ▲ 0.01% USD/MXN 17.06 ▼ 0.24% USD/CLP 913.98 ▲ 0.04% USD/COP 3,140 ▲ 0.03% USD/PEN 3.36 ▼ 0.66% USD/ARS 1,493 ▲ 0.10% USD/UYU 40.27 ▲ 1.24% USD/PYG 5,939 ▲ 1.68% USD/BOB 11.64 ▼ 0.76% USD/DOP 58.34 ▲ 1.25% USD/CRC 445.92 ▲ 0.89% USD/GTQ 7.62 ▲ 2.21% USD/HNL 26.79 ▲ 1.57% USD/NIO 36.62 ▲ 0.69% USD/VES 762.44 ▼ 0.13% USD/PAB 1.00 — 0.00% USD/BZD 2.00 — 0.00% USD/JMD 157.28 — 0.00% USD/TTD 6.70 ▲ 0.61% EUR/BRL 5.95 ▲ 1.01% BRENT 88.88 ▼ 0.03% WTI 83.11 ▼ 0.11% IRON ORE 161.91 — — COPPER 6.61 ▲ 0.03% GOLD 4,461 ▲ 1.78% SILVER 65.59 ▲ 1.26% SOY 1,184 ▲ 3.20% CORN 480.50 ▲ 10.02% WHEAT 655.00 ▲ 3.93% COFFEE 317.25 ▼ 5.51% SUGAR 16.43 ▼ 1.79% ORANGE JUICE 138.55 ▼ 0.47% COTTON 85.03 ▲ 2.33% COCOA 5,719 ▲ 3.18% BEEF 223.60 ▼ 3.93% CATTLE 339.10 ▼ 3.16% LITHIUM 75.20 ▲ 1.47% PETR4 41.64 ▼ 0.05% VALE3 72.97 ▲ 0.83% ITUB4 38.60 ▼ 1.03% BBDC4 16.85 ▲ 0.36% ABEV3 14.89 ▼ 0.80% BBAS3 19.37 ▲ 0.47% B3SA3 14.26 ▼ 0.21% WEGE3 47.59 ▲ 0.49% PRIO3 59.14 ▼ 0.19% SUZB3 41.33 ▲ 2.35% RENT3 34.68 ▼ 0.09% AZZA3 15.89 ▼ 2.63% CSAN3 3.22 ▼ 1.83% RAIZ4 0.25 — 0.00% PCAR3 2.75 ▼ 0.36% GMAT3 3.65 ▼ 1.08% PSSA3 48.13 ▼ 0.54% CVCB3 1.33 ▼ 2.92% POSI3 3.36 ▲ 2.44% SLCE3 13.34 ▲ 0.30% NATU3 8.14 ▼ 0.73%
since 2009
Wednesday, October 7, 2026

World-News North America

U.S. Growth Outpaces Rivals, But Real Factory Output Trails Expectations

By · August 29, 2025 · 2 min read

The latest U.S. data shows an economy that looks powerful on the surface but more complicated underneath. Growth in the second quarter reached 3.3% annualized, far stronger than Europe or Japan.

Households continue to spend, with July personal consumption up 0.5% and incomes rising 0.4%. Inflation, measured by the Fed’s preferred PCE index, held steady at 2.9% year over year.

That is above target but no longer climbing, giving consumers more breathing space. Manufacturing, however, is where the numbers appear to clash. On August 21, business surveys reported the strongest factory expansion since mid-2022.

The national PMI climbed to 53.3, and the New York Fed’s Empire State index showed a big jump in orders and investment plans. Companies reported new commitments to plants and equipment, pointing to a revival in domestic industry.

But government data for July told a slower story. Durable goods orders fell 2.8% overall, even though core business orders excluding aircraft rose 1.1%. Today’s Chicago PMI dropped sharply to 41.5, deep in contraction territory.
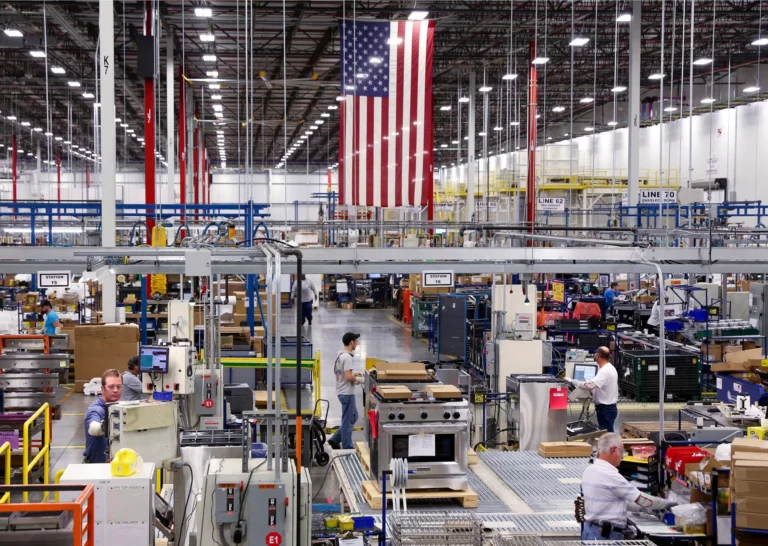
U.S. Growth Outpaces Rivals, But Real Factory Output Trails Expectations
U.S. Growth Outpaces Rivals, But Real Factory Output Trails Expectations.
RT
Ask Rio Times
17 years of Latin America reporting, on demand.
Open the full Ask Rio Times →

The goods trade deficit also widened to $103.6 billion in July, the largest in months. The way to read this is simple: surveys measure expectations, while official statistics capture what has already happened.

The LatAm Brief

One email, every weekday morning. What moved in Latin American markets, politics and expat life.

Yesterday’s subject line: “Mexico sells record US$60.6bn to the US in August”

Free. We send a confirmation link first — nothing arrives until you click it. Unsubscribe with one click in any edition. If you stop opening us for 30 days we stop sending by ourselves, as we assume the interest is no longer there. See our privacy policy. We never share your email.

Factories are preparing for more output, but the hard data shows production and trade have not yet caught up with that optimism. The labor market adds balance.

Jobless claims remain historically low, and employers are holding onto staff. But consumer sentiment, tracked by the University of Michigan, fell in August to 58.2, showing households are less confident even as they continue to spend.

The bigger picture is that America still outpaces its peers because services and household demand are carrying the economy. Manufacturing may be turning a corner, but its recovery is uneven.

Businesses abroad should see a U.S. economy that remains resilient but increasingly dependent on consumers, with factories still in the early stages of a rebound.

This article was produced by The Rio Times’ automated newsroom system. How we use AI · Report an error · Editorial responsibility: Matthias Camenzind, Editor-in-Chief

The Rio Times · Power Map
See who really holds power in Latin America
Click to open the Power Map →

Rotate for Best Experience

This report is optimized for landscape viewing. Rotate your phone for the full experience.