IBOV 177,599.57 ▲ 1.10% IPSA 11,335.31 ▼ 0.97% IPC MEX 65,048.39 ▼ 0.67% MERVAL 3,052,917 ▲ 2.47% COLCAP 2,476.26 ▲ 0.75% BVL PERÚ 59,928.30 ▲ 0.07% USD/BRL5.18▼ 0.18% USD/MXN16.99▼ 0.25% USD/CLP934.80▲ 0.36% USD/COP3,218▲ 0.58% USD/PEN3.37▲ 0.46% USD/ARS1,509▼ 0.28% USD/UYU40.29▲ 0.05% USD/PYG5,892▼ 0.13% USD/BOB11.84▲ 0.51% USD/DOP58.64▲ 0.05% USD/CRC446.47▼ 0.04% USD/GTQ7.62▼ 0.02% USD/HNL26.84— 0.00% USD/NIO36.62— 0.00% USD/VES793.00▼ 0.13% USD/PAB1.00— 0.00% USD/BZD2.00— 0.00% USD/JMD 157.28 — 0.00% USD/TTD6.69▼ 0.37% EUR/BRL6.02▼ 0.10% BRENT 88.88 ▼ 0.03% WTI 83.11 ▼ 0.11% IRON ORE 161.91 — — COPPER 6.61 ▲ 0.03% GOLD 4,461 ▲ 1.78% SILVER 65.59 ▲ 1.26% SOY 1,184 ▲ 3.20% CORN 480.50 ▲ 10.02% WHEAT 655.00 ▲ 3.93% COFFEE 317.25 ▼ 5.51% SUGAR 16.43 ▼ 1.79% ORANGE JUICE 138.55 ▼ 0.47% COTTON 85.03 ▲ 2.33% COCOA 5,719 ▲ 3.18% BEEF 223.60 ▼ 3.93% CATTLE 339.10 ▼ 3.16% LITHIUM 75.20 ▲ 1.47% PETR4 41.64 ▼ 0.05% VALE3 72.97 ▲ 0.83% ITUB4 38.60 ▼ 1.03% BBDC4 16.85 ▲ 0.36% ABEV3 14.89 ▼ 0.80% BBAS3 19.37 ▲ 0.47% B3SA3 14.26 ▼ 0.21% WEGE3 47.59 ▲ 0.49% PRIO3 59.14 ▼ 0.19% SUZB3 41.33 ▲ 2.35% RENT3 34.68 ▼ 0.09% AZZA3 15.89 ▼ 2.63% CSAN3 3.22 ▼ 1.83% RAIZ4 0.25 — 0.00% PCAR3 2.75 ▼ 0.36% GMAT3 3.65 ▼ 1.08% PSSA3 48.13 ▼ 0.54% CVCB3 1.33 ▼ 2.92% POSI3 3.36 ▲ 2.44% SLCE3 13.34 ▲ 0.30% NATU3 8.14 ▼ 0.73% IBOV 177,599.57 ▲ 1.10% IPSA 11,335.31 ▼ 0.97% IPC MEX 65,048.39 ▼ 0.67% MERVAL 3,052,917 ▲ 2.47% COLCAP 2,476.26 ▲ 0.75% BVL PERÚ 59,928.30 ▲ 0.07% USD/BRL 5.16 ▲ 0.01% USD/MXN 17.06 ▼ 0.24% USD/CLP 913.98 ▲ 0.04% USD/COP 3,140 ▲ 0.03% USD/PEN 3.36 ▼ 0.66% USD/ARS 1,493 ▲ 0.10% USD/UYU 40.27 ▲ 1.24% USD/PYG 5,939 ▲ 1.68% USD/BOB 11.64 ▼ 0.76% USD/DOP 58.34 ▲ 1.25% USD/CRC 445.92 ▲ 0.89% USD/GTQ 7.62 ▲ 2.21% USD/HNL 26.79 ▲ 1.57% USD/NIO 36.62 ▲ 0.69% USD/VES 762.44 ▼ 0.13% USD/PAB 1.00 — 0.00% USD/BZD 2.00 — 0.00% USD/JMD 157.28 — 0.00% USD/TTD 6.70 ▲ 0.61% EUR/BRL 5.95 ▲ 1.01% BRENT 88.88 ▼ 0.03% WTI 83.11 ▼ 0.11% IRON ORE 161.91 — — COPPER 6.61 ▲ 0.03% GOLD 4,461 ▲ 1.78% SILVER 65.59 ▲ 1.26% SOY 1,184 ▲ 3.20% CORN 480.50 ▲ 10.02% WHEAT 655.00 ▲ 3.93% COFFEE 317.25 ▼ 5.51% SUGAR 16.43 ▼ 1.79% ORANGE JUICE 138.55 ▼ 0.47% COTTON 85.03 ▲ 2.33% COCOA 5,719 ▲ 3.18% BEEF 223.60 ▼ 3.93% CATTLE 339.10 ▼ 3.16% LITHIUM 75.20 ▲ 1.47% PETR4 41.64 ▼ 0.05% VALE3 72.97 ▲ 0.83% ITUB4 38.60 ▼ 1.03% BBDC4 16.85 ▲ 0.36% ABEV3 14.89 ▼ 0.80% BBAS3 19.37 ▲ 0.47% B3SA3 14.26 ▼ 0.21% WEGE3 47.59 ▲ 0.49% PRIO3 59.14 ▼ 0.19% SUZB3 41.33 ▲ 2.35% RENT3 34.68 ▼ 0.09% AZZA3 15.89 ▼ 2.63% CSAN3 3.22 ▼ 1.83% RAIZ4 0.25 — 0.00% PCAR3 2.75 ▼ 0.36% GMAT3 3.65 ▼ 1.08% PSSA3 48.13 ▼ 0.54% CVCB3 1.33 ▼ 2.92% POSI3 3.36 ▲ 2.44% SLCE3 13.34 ▲ 0.30% NATU3 8.14 ▼ 0.73%
since 2009
Monday, August 31, 2026

Peru’s Exports Surge by 17.1% Through July 2025, Driven by Mining, Agriculture and Fisheries

By · September 9, 2025 · 2 min read

Daily Brief

The morning intel from across Latin America. Free.

By subscribing you agree to our privacy policy. We never share your email.

Peru’s Ministry of Foreign Trade and Tourism reported exports of US $46.93 billion from January to July 2025, a 17.1 percent rise over the same period in 2024.

This growth reflects strong global demand for Peru’s mineral and food commodities and highlights how regional producers now reach 164 markets.

The mining sector led the expansion with US $30.52 billion in shipments, up 18.2 percent year-on-year. Gold exports jumped by 44.4 percent while copper rose 9.2 percent.

Meanwhile silver concentrates, zinc, tin, lead and molybdenum all recorded double-digit growth. Agro-exports contributed US $6.76 billion, climbing 20.2 percent thanks to larger volumes of fruits and specialty crops.

Shipments of mangoes increased by 60 percent, grapes by 41.5 percent and cocoa and its derivatives by 47.6 percent. Producers also lifted shipments of natural colorants and other processed goods.
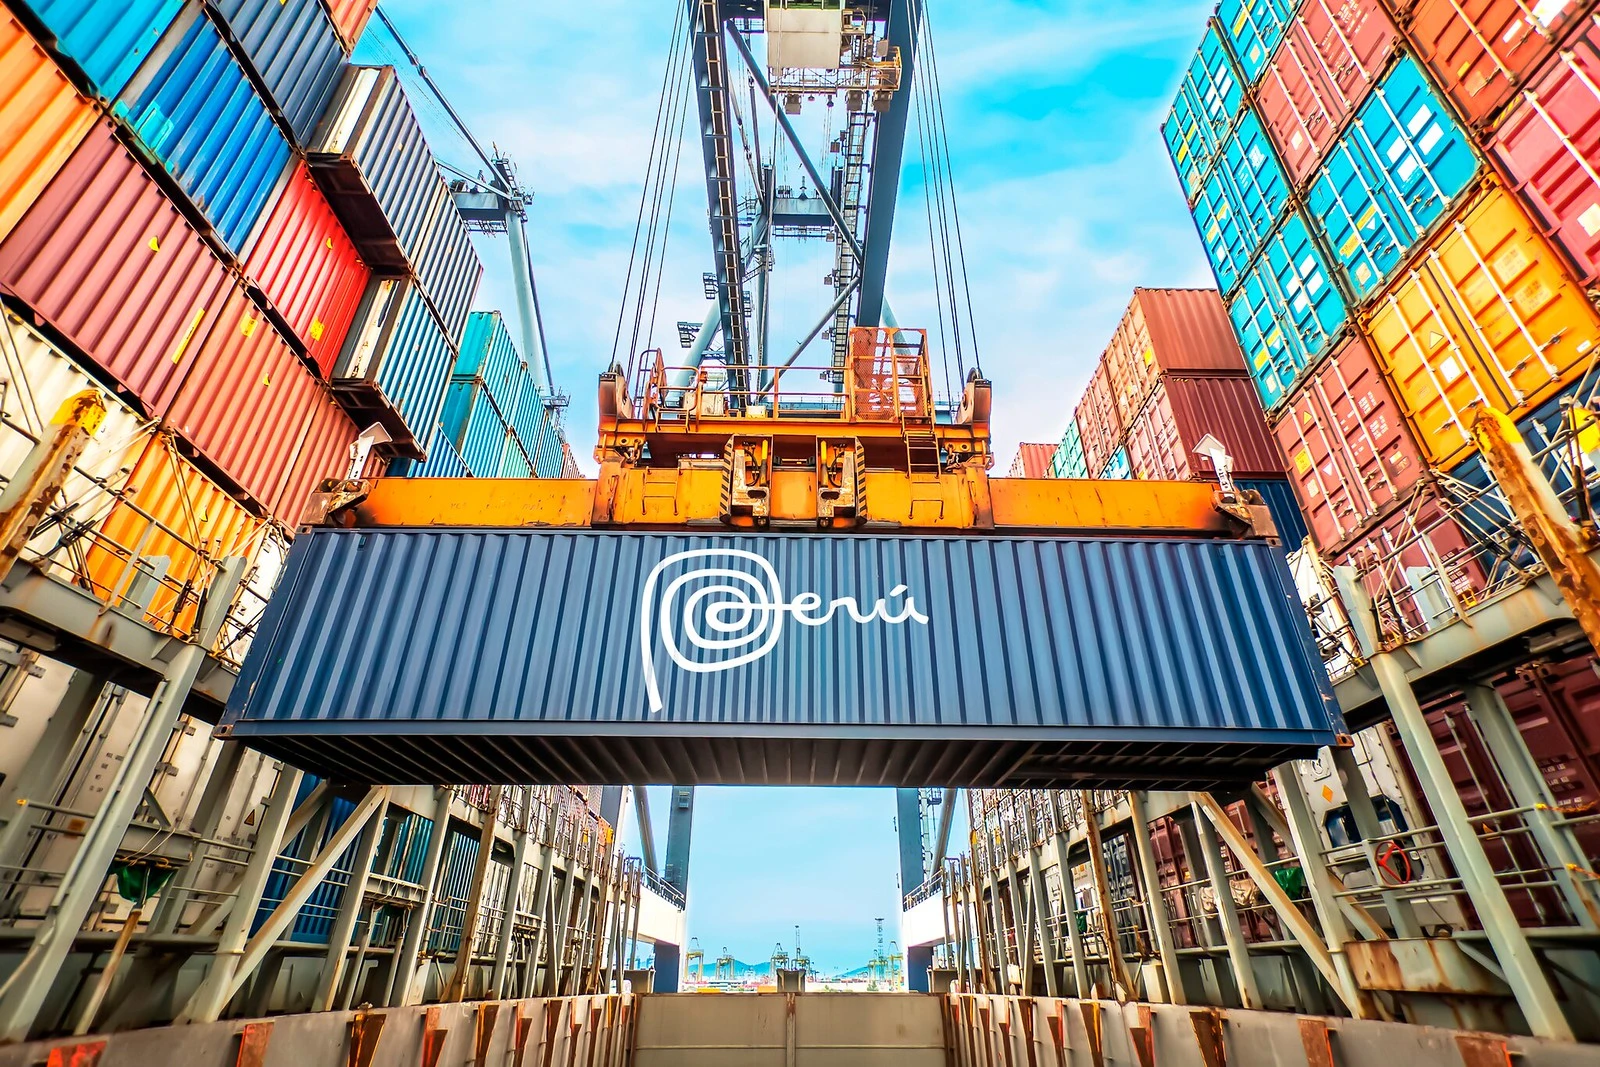
Peru’s Exports Surge by 17.1% Through July 2025, Driven by Mining, Agriculture and Fisheries
Peru’s Exports Surge by 17.1% Through July 2025, Driven by Mining, Agriculture and Fisheries. (Photo Internet reproduction)
One-stop reference
Company Intelligence
Every listed company in Latin America — financials, ownership and structure for 1,450+ companies across 26 exchanges, in one place.
Browse the directory →
RT
Ask Rio Times
17 years of Latin America reporting, on demand.
Open the full Ask Rio Times →

The fisheries sector registered US $3.07 billion, a 26.9 percent gain led by pota, a squid-like species. Pota exports set a record at US $907 million, surpassing the 2019 level and underscoring Peru’s competitive seafood processing.

Chemical exports advanced sharply in explosives (+74 percent), tires (+24 percent), beverage bases (+19 percent) and pharmaceuticals (+11 percent). Textiles reached US $1.014 billion, up 8.6 percent.

China remained Peru’s top destination with US $17.03 billion, a 19.8 percent increase. The European Union followed at US $5.30 billion, up 23.2 percent, and the United States received US $4.91 billion, up 9.9 percent.

Notably, the United Arab Emirates absorbed US $2.15 billion in exports, up 45.7 percent, while Australia logged US $658 million, a dramatic 1,114 percent increase driven by gold, coffee and quinoa.

Exporting businesses climbed by 3.7 percent to 8,062 firms. Inland regions also saw strong performance: Huánuco led with a 258.8 percent boost, San Martín rose 112.6 percent and Amazonas gained 97 percent. These gains show how diversification efforts extend beyond Peru’s Pacific ports.

This export surge matters because it sustains jobs in mining, farming and fishing communities. It also strengthens small and medium enterprises by opening new markets.

Furthermore, earning foreign currency buffers the economy against domestic fluctuations and global price swings. Looking ahead, Peru’s capacity to scale value-added processing and foster regional producers will determine whether this momentum continues.

Meanwhile businesses and policymakers must focus on logistics, quality standards and market access to sustain growth and diversify beyond raw materials.

This article was produced by The Rio Times’ automated newsroom system. How we use AI · Report an error

Read More from The Rio Times

The Rio Times · Power Map
See who really holds power in Latin America
Click to open the Power Map

Rotate for Best Experience

This report is optimized for landscape viewing. Rotate your phone for the full experience.