São Paulo Office Market Rebounds: Vacancy Rates Hit 3-Year Low in 2024
The office market in São Paulo has shown remarkable resilience and growth in 2024, signaling a strong recovery from the challenges posed by the pandemic.
Recent data reveals encouraging trends in the city’s corporate real estate sector, with declining vacancy rates and increasing absorption of office space.
São Paulo’s office vacancy rate fell to 19.3% in the third quarter of 2024, marking a 0.5 percentage point decrease and the lowest level in three years.
This decline is particularly significant for the city’s corporate real estate sector, as it indicates a growing demand for office space.
For high-end “triple A” or “AAA” buildings, the vacancy rate remained stable at 17% compared to the previous quarter.
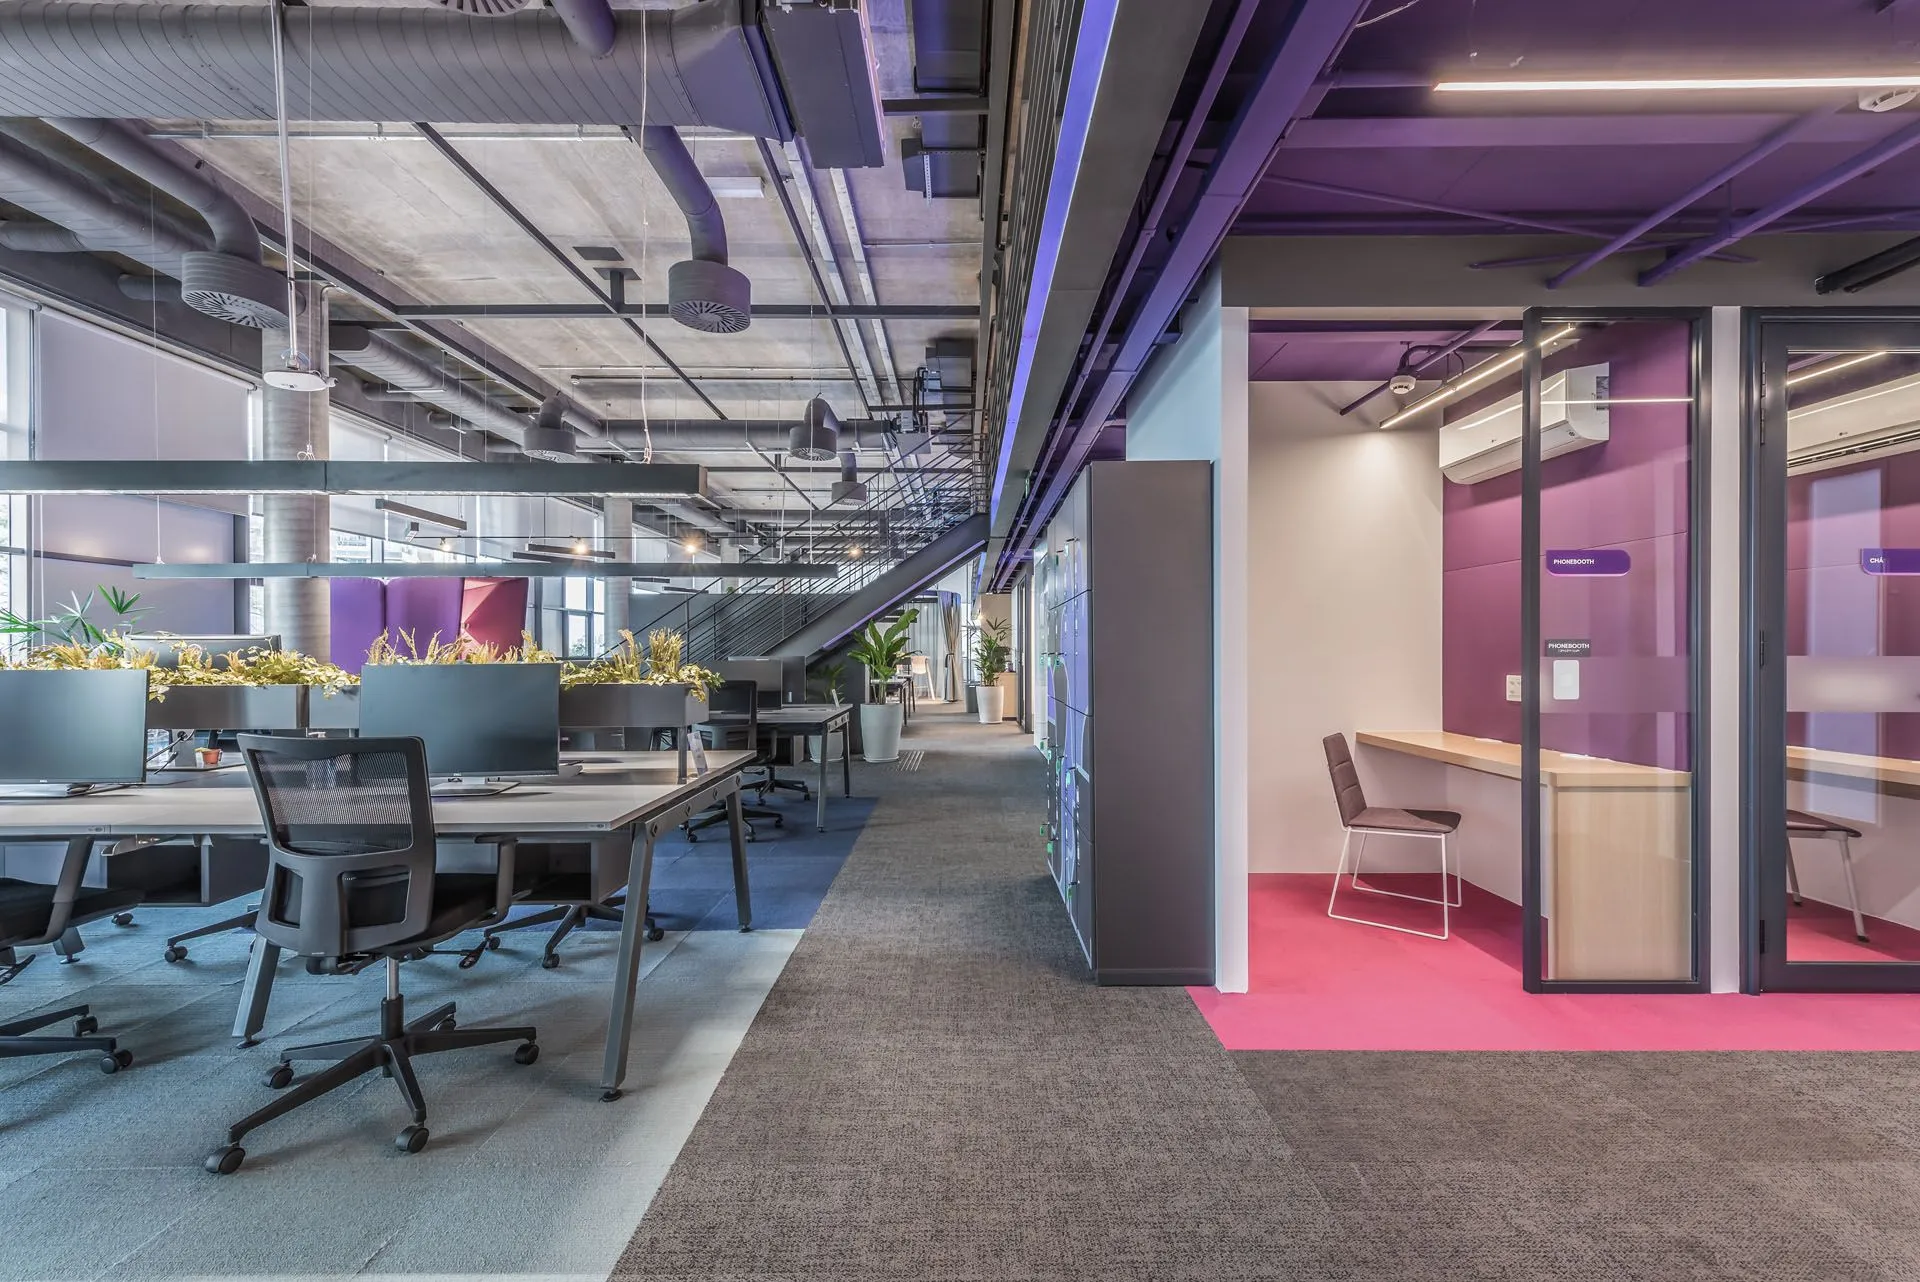
This stability in premium office spaces suggests a consistent demand for top-tier corporate real estate in São Paulo.
Market Growth and Absorption
The city’s office market has shown impressive growth in 2024:
- The total office stock in São Paulo surpassed 12 million square meters in the first half of 2024.
- New stock additions reached 72,256 square meters, with 18,000 square meters in Q1 and 53,000 square meters in Q2 2024.
- Net absorption totaled 86,000 square meters in Q3 2024, representing a 50% increase from the same period in 2023.
São Paulo now ranks third among 20 capital cities globally in office space absorption for 2024, surpassed only by Tokyo and Beijing.
Regional Performance
Several regions in São Paulo contributed to the market’s growth in the first half of 2024:
- Pinheiros: Added 20,000 square meters (Q2 2024)
- Moema/Vila Mariana: Added over 13,500 square meters (Q2 2024)
- Panamby Morumbi: Added over 13,000 square meters (Q1 2024)
- Paulista: Added over 8,000 square meters (Q2 2024)
- Nova Faria Lima: Added over 7,400 square meters (Q2 2024)
Rental Prices and Market Valuation
The average asking rent for Class A+/A corporate office space in São Paulo increased to R$102.19 per square meter in Q2 2024, up from R$101.83 in Q1. Notable increases were observed in prime locations:
- Nova Faria Lima: R$242.58 per square meter in Q2 2024
- Pinheiros: Increased from R$157.18 in Q1 to R$160.32 in Q2 2024
Investment Opportunities and Outlook
The improving market conditions have caught the attention of investors and analysts. Caio Araujo from Empiricus Research notes that the office market is experiencing its best performance in four years.
Improved negotiation conditions are benefiting real estate investment trusts (REITs). One recommended REIT is Rio Bravo Renda Corporativa (RCRB11), which owns nine properties.
These properties are located in São Paulo and Rio de Janeiro. This fund has significantly reduced its vacancy rate from 34% to 1.4% over the past three years.
Conclusion
The São Paulo office market demonstrates strong potential for growth and attractiveness to companies seeking strategic locations, quality infrastructure, and a dynamic business environment.
While investors should approach with informed caution, the sector offers promising opportunities for those looking to capitalize on the recovering corporate real estate market in Brazil’s largest city.
More: Brazil news in English, every day from The Rio Times.
This article was produced by The Rio Times’ automated newsroom system. How we use AI · Report an error · Editorial responsibility: Matthias Camenzind, Editor-in-Chief
Living in or visiting São Paulo? See this month's events and our São Paulo city guide with rents, safety and upcoming concerts.