Brazil Faces Shifting Global Markets as Tariffs Reshape Export Landscape
Brazilian exporters are navigating a new global environment as tariff disputes between the United States and China reshape international trade.
Analysis from S&P Global and industry data show that while Brazil has avoided the harshest direct impacts, indirect effects are spreading across its main export sectors. Agriculture remains the backbone of Brazil’s export economy.
After China imposed tariffs as high as 125% on U.S. goods, Brazilian soybeans filled much of the resulting gap. Brazilian soy now accounts for up to 80% of China’s imports, but further growth is limited.
Beef exports have also increased, yet sanitary restrictions and changing Chinese policies have capped additional gains. At the same time, the U.S. has signaled it may push trade partners to buy more American farm products, which could reduce Brazil’s market share.
Brazilian steel producers have increased exports to the U.S., supplying over 60% of America’s semi-finished steel imports in 2024. However, this growth has a downside.
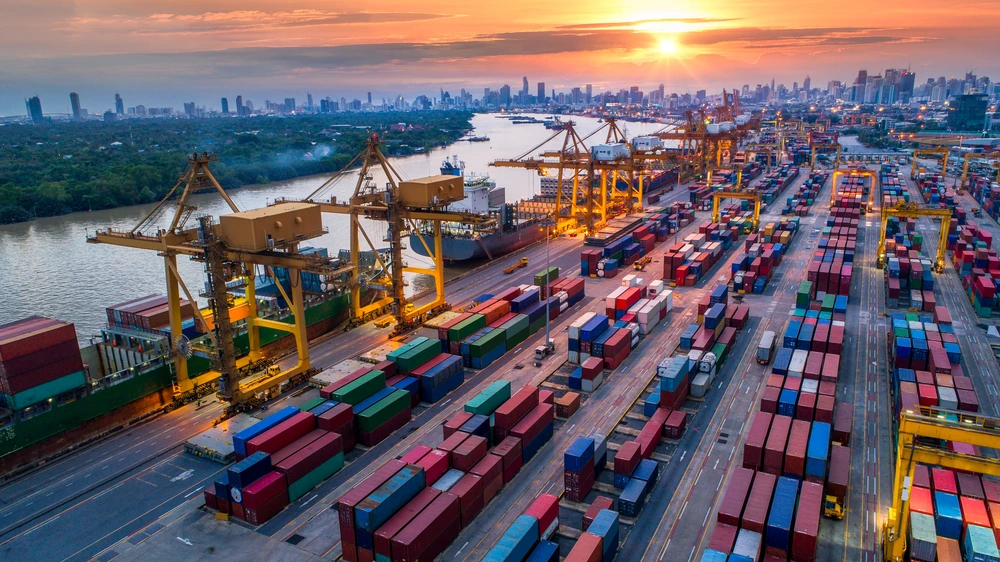
Cheaper steel from China and other countries, redirected by U.S. tariffs, has flooded Brazil’s domestic market. Steel imports into Brazil jumped by 50% in 2023, reaching a record 5 million tonnes.
The local industry is now pushing for higher import tariffs, warning that continued price drops threaten domestic producers. The pulp and paper sector has remained resilient.
Brazil’s Economic Landscape Amid Rising Tariffs
Brazil, the world’s largest pulp exporter, saw shipments rise by more than 23% in 2024. The U.S. imposed a 10% tariff on Brazilian pulp, but strong demand from China and Europe has offset any losses.
Most U.S. pulp and paper companies run integrated supply chains, so their reliance on imports is limited. Automotive exports from Brazil to the U.S. are small, which limits direct exposure to American tariffs.
Yet, indirect risks are growing. Mexico, now facing higher U.S. tariffs, may redirect its automotive exports to Brazil and other Latin American countries. This could increase competition for Brazilian manufacturers and put pressure on local jobs.
The broader economic effects remain uncertain. Brazil’s relatively closed economy and independence from major trade blocs have shielded it from the worst shocks.
Some economic models suggest these tariff disputes could even boost Brazil’s GDP by 0.1 percentage point in 2025, mainly through gains in agriculture and select manufacturing.
However, a global slowdown could depress commodity prices and weaken the Brazilian real, raising inflation risks. Supply chains are adapting. Companies are moving production closer to home and reducing reliance on China, aiming to buffer future disruptions.
These changes are costly and take time. Brazilian exporters now operate in a world where tariffs can change quickly and supply chains must adjust fast. While some sectors find new opportunities, others face rising challenges.
The real story is how Brazilian industries adapt, balancing gains in global markets with increased competition and uncertainty at home. All figures and claims in this report are based on verified industry and trade data as of April 2025.
More: Brazil news in English, every day from The Rio Times.
This article was produced by The Rio Times’ automated newsroom system. How we use AI · Report an error · Editorial responsibility: Matthias Camenzind, Editor-in-Chief
LatAm Markets: Live Signals → — real-time movers, turnover leaders and FX across Latin America.