Brazil concentrates sales in China like no other major economy, this may be a problem
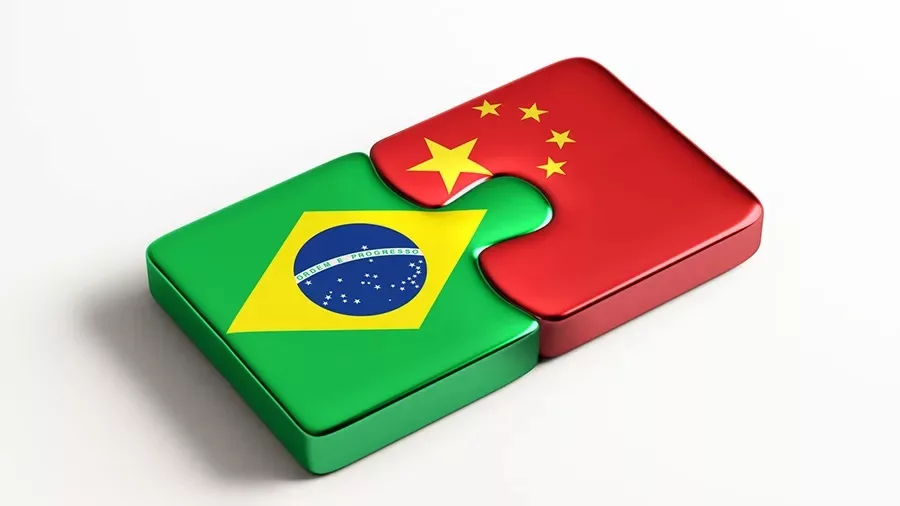
RIO DE JANEIRO, BRAZIL – Brazil was the seventh country that sold the most products to China in 2021, which contributed to guaranteeing a record surplus in the Brazilian trade balance last year.
Among the ten countries that sold the most products last year to the world’s second-largest economy, however, Brazil was the one that had the most concentrated agenda. Only ten products were responsible for 91.4% of the total value that Brazil exported to China last year.
China’s increasing share in Brazilian exports, concentrated in just a few items, is only paralleled by large oil exporters such as Angola, Qatar, and Oman (which sell very few products to China) and exposes the performance of Brazilian shipments not only to the ongoing volatility of commodity prices but also to the expected slowdown in the Asian country, point out specialists.
The International Monetary Fund (IMF) projects a 4.4% growth in China’s GDP in 2022 after an 8.1% advance in 2021.
With a similar dynamic to that of Brazil, although with a lower concentration of exports, is Australia, the fifth country that sold the most to China last year, with the “top ten” products accounting for 88.2% of the value shipped.
Russia, tenth in the ranking of the biggest exporters, has a concentration of 75%. Taiwan is the first supplier for the Chinese, with the top ten products reaching 71.2% of their shipments.
The picture of these countries contrasts with those of South Korea, Japan, and the United States, which follow in this order Taiwan among China’s largest suppliers. The three countries have a much lower concentration of the ten most sold products: 51.5%, 20.5%, and 37%, respectively, according to Chinese government data.
Among the 50 largest GDPs on the planet, only Nigeria (the 31st largest global economy) and Iraq (the 47th) have sales to China that are more concentrated in ten products than Brazil’s – expected to be the tenth-largest in the world this year.
In both cases, oil is the main product sold to the Chinese. Iraq is the third-largest oil supplier to the Asian country, representing 99.3% of its sales last year.
Even being the seventh-largest supplier to the Chinese last year, Brazil was the leader in sales to the Asian country in only 48 products. The champion in this ranking was Japan, with 1,444 items, followed by Germany, with 856 products, and the United States, with 796.
Figures available from the Brazilian side also show a concentration of the export agenda. Last year the Chinese absorbed 31.3% of total Brazilian exports, a share nine percentage points higher than in 2017, data from the Ministry of Economy show.
The participation of the ten largest products in the value shipped remained high, advancing from 89% in 2017 to 91.4% of exports to China in 2021.
Even within the “top ten”, there is great concentration. The three top products on the agenda – iron ore, soybeans, and oil – added up to 80% of what Brazil sold to China last year.
The concentrated structure favored Brazil last year when iron ore hit historic highs. In 2021 the Chinese bought US$87.9 billion in Brazilian products, 29.7% more than the previous year. The performance contributed to a record Brazilian trade surplus of US$61.4 billion.
“As the concentrated agenda has guaranteed surpluses, there is an accommodation, with no effort to diversify,” says José Augusto de Castro, president of the Brazilian Foreign Trade Association (AEB).
The problem, he points out, is that this also subjects exports to price volatility and the performance of the Chinese economy. For him, the vocation for shipping commodities should be taken advantage of, but also with a parallel policy that stimulates the exportation of manufactured goods.
Although prices are still making a positive contribution, Brazilian exports are already starting to feel the effects of the adjustment in commodity prices in 2022. Castro highlighted that the major impact in June, in this sense, came from iron ore.
According to data from the Foreign Trade Secretariat (Secex/ME), the commodity’s export revenue fell 40.5% in June against the same month last year. There was a reduction of 4.3% in quantity shipped, and the average prices of the item dropped 37.8% in the same comparison.
This probably contributed, says Castro, to the 11.7% drop in the value of exports to China in June against the same month of 2021.
With the performance, the Asian country absorbed 29.1% of the values exported by Brazil in June this year, nine percentage points less than the 38.1% share it held in the same month last year. The figures include Hong Kong and Macau – in Chinese foreign trade data, the two places are counted separately.
In the year to June, China’s share in Brazilian exports fell from 35.3% in 2021 to 29.1% this year. The average price of total iron ore exported by Brazil in the period fell 25.4% in the first half of this year compared to the same months last year, contributing strongly to a 31.5% drop in export revenues by the same comparison. The quantity also fell, but at a lower rate, by 8.2%.
“Since there are only a few products and they are very representative in the list of shipments, a shock in one of them ends up having an immense contribution to the relations in the aggregate list,” explains Livio Ribeiro, partner at BRCG and researcher at the Brazilian Institute of Economics of the Getulio Vargas Foundation (FGV Ibre).
“China is currently going through a particularly delicate moment,” Ribeiro says. He explains that Beijing has been trying to reactivate more aggregate demand through the “old China” stimulus, which focused on investments in infrastructure. But it is unknown whether this will be enough because consumer confidence has collapsed with the new outbreaks of covid-19.
“There’s chronic difficulty in stimulating Chinese consumer demand, which makes sense since, at the limit, people leave for work and don’t know if they’ll be back at the end of the day because there could be a lockdown halfway through.”
There was recently a first major move to make some parameters less aggressive in the Chinese covid-19 protocols, with a reduction in the number of the lockdown period, but zero tolerance has remained, Ribeiro says.
“Although the nature of this shock is very specific because it focuses on household consumption, most of the Chinese government’s policies don’t look at that. There is no cash transfer program. Nor security, broadly speaking. And the chance of measures in this direction happening in a short period is almost zero.”
Instead, he explains, the Chinese measures have been focused on companies, prioritizing infrastructure, granting credit to companies, and maintaining ample liquidity.
Given this picture, BRCG’s estimate for Chinese GDP growth in 2022 is 3.8%. “To reach 4% will take a lot of fighting. For 4.5%, a monumental effort,” Ribeiro evaluates.
Fabio Silveira, partner-director of MacroSector, projects growth between 3.5% and 4% for the Chinese economy this year. “China’s growth should go from an annual average of close to 5.5% in the last three years to an average between 3% and 3.5% in the next three years. A reduction with great impact because we are talking about the second-largest economy in the world.”
In this scenario, according to Ribeiro, the agricultural and livestock products exported by Brazil, such as soybeans and beef, are the ones that can be most affected in the short term. “Because there is a consumption restriction at the moment. The restriction is not inflationary, but it is by the increase in the marginal propensity to save, which has an impact on everything.”
Another unfavorable point for beef, Ribeiro evaluates, is that it is not the standard protein for Chinese consumption, which is pork. In the case of soy, used as feed for raising chickens and pigs, he says, the imports are slower at this time because the sale price of feed in the Chinese market was below the cost of grinding soy, a secondary symptom of the lower level of consumption in the country.
In the extractive sector, the demand for iron ore volumes, evaluates the economist, should suffer relatively less due to China’s attempt to maintain more accelerated investments. As for oil, he says, the Chinese option to buy more from Russia may displace other markets, which may affect Brazil.
In 2021, China absorbed, in value, 70.4% of all soybean exported by Brazil. In iron ore, the share was 69.7%, and in oil, 46.6%. The Chinese also bought 56.2% of all Brazilian boneless frozen beef shipped last year.
Last year, Brazil was the largest supplier of soybeans and frozen boneless beef to China, the second of iron ore, and the seventh of oil.
For Silveira, even with the global slowdown and that of China, with effects on the prices of essential commodities in the export agenda, the Brazilian balance should close 2022 with a relatively robust surplus, between US$45 billion and US$50 billion.
However, the yellow light lights up for next year, when the trade balance may become flatter and no longer contribute favorably to the foreign sector.
With information from Valor Econômico
More: Angola news in English, every day from The Rio Times.
Live Market IntelligenceBrazil — Live Market Board
Rio Times · Live Market Intelligence
Brazil — Live Market Board
+0.15%
204,626.74
+0.15%
67,663.29
+1.31%
10,944.69
-0.25%
2,848,932
-0.35%
2,577.69
-0.11%
60,210.69
-0.11%
| Instrument | Last | Change | YoY | Prev. | High | Low | Volume |
|---|---|---|---|---|---|---|---|
| IBOV | 204,626.74 | +0.15% | +21.85% | 204,324.26 | 168,310 | 167,142 | — |
| USD/BRL | 5.16 | +0.01% | -5.13% | 5.16 | 5.18 | 5.14 | — |
| SELIC | 14.00% | — | — | — | — | — | |
| PETR4 | 41.64 | -0.05% | +35.19% | 41.66 | 41.97 | 41.15 | 41,499,400 |
| VALE3 | 72.97 | +0.83% | +30.75% | 72.37 | 73.54 | 72.66 | 17,658,000 |
| ITUB4 | 38.60 | -1.03% | +4.57% | 39.00 | 39.34 | 38.39 | 29,487,800 |
| BBDC4 | 16.85 | +0.36% | +3.50% | 16.79 | 16.90 | 16.67 | 19,416,900 |
| BBAS3 | 19.37 | +0.47% | +0.73% | 19.28 | 19.44 | 19.16 | 11,069,200 |
| B3SA3 | 14.26 | -0.21% | +12.73% | 14.29 | 14.47 | 14.11 | 33,037,800 |
| ABEV3 | 14.89 | -0.80% | +21.91% | 15.01 | 15.07 | 14.81 | 16,453,100 |
| WEGE3 | 47.59 | +0.49% | +29.99% | 47.36 | 48.08 | 47.36 | 3,364,600 |
| PRIO3 | 59.14 | -0.19% | +50.67% | 59.25 | 59.81 | 58.74 | 3,325,600 |
| SUZB3 | 41.33 | +2.35% | -23.55% | 40.38 | 41.48 | 40.35 | 3,914,900 |
| RENT3 | 34.68 | -0.09% | +0.84% | 34.71 | 34.96 | 34.35 | 7,979,100 |
| AZZA3 | 15.89 | -2.63% | -53.76% | 16.32 | 16.42 | 15.82 | 1,330,300 |
| CSNA3 | 4.30 | +0.47% | -42.65% | 4.28 | 4.41 | 4.26 | 10,076,100 |
| GGBR4 | 24.69 | +2.19% | +51.38% | 24.16 | 24.85 | 24.18 | 7,047,600 |
| ENEV3 | 24.21 | -1.38% | +70.49% | 24.55 | 24.64 | 23.99 | 9,297,000 |
Editorial responsibility: Matthias Camenzind, Editor-in-Chief · Editorial standards · Report an error