IBOV 205,430.33 ▲ 0.54% IPSA 10,969.16 ▼ 0.02% IPC MEX 68,929.72 ▲ 1.87% MERVAL 2,848,945 ▼ 0.35% COLCAP 2,566.28 ▼ 0.55% BVL PERÚ 60,210.69 ▼ 0.91% USD/BRL5.07▲ 0.09% USD/MXN18.50▲ 0.45% USD/CLP984.38— 0.00% USD/COP3,171▼ 0.15% USD/PEN3.43▼ 0.11% USD/ARS1,518▲ 0.30% USD/UYU40.13▲ 3.08% USD/PYG5,686▲ 3.07% USD/BOB11.61▲ 2.27% USD/DOP61.26▲ 0.43% USD/CRC448.47▲ 1.59% USD/GTQ7.65▲ 3.30% USD/HNL26.86▲ 0.34% USD/NIO36.62▲ 2.76% USD/VES877.92▼ 0.13% USD/PAB1.00— 0.00% USD/BZD2.00— 0.00% USD/JMD 157.28 — 0.00% USD/TTD6.73▲ 2.13% EUR/BRL5.71▲ 1.16% BRENT 88.88 ▼ 0.03% WTI 83.11 ▼ 0.11% IRON ORE 161.91 — — COPPER 6.61 ▲ 0.03% GOLD 4,461 ▲ 1.78% SILVER 65.59 ▲ 1.26% SOY 1,184 ▲ 3.20% CORN 480.50 ▲ 10.02% WHEAT 655.00 ▲ 3.93% COFFEE 317.25 ▼ 5.51% SUGAR 16.43 ▼ 1.79% ORANGE JUICE 138.55 ▼ 0.47% COTTON 85.03 ▲ 2.33% COCOA 5,719 ▲ 3.18% BEEF 223.60 ▼ 3.93% CATTLE 339.10 ▼ 3.16% LITHIUM 75.20 ▲ 1.47% PETR4 41.64 ▼ 0.05% VALE3 72.97 ▲ 0.83% ITUB4 38.60 ▼ 1.03% BBDC4 16.85 ▲ 0.36% ABEV3 14.89 ▼ 0.80% BBAS3 19.37 ▲ 0.47% B3SA3 14.26 ▼ 0.21% WEGE3 47.59 ▲ 0.49% PRIO3 59.14 ▼ 0.19% SUZB3 41.33 ▲ 2.35% RENT3 34.68 ▼ 0.09% AZZA3 15.89 ▼ 2.63% CSAN3 3.22 ▼ 1.83% RAIZ4 0.25 — 0.00% PCAR3 2.75 ▼ 0.36% GMAT3 3.65 ▼ 1.08% PSSA3 48.13 ▼ 0.54% CVCB3 1.33 ▼ 2.92% POSI3 3.36 ▲ 2.44% SLCE3 13.34 ▲ 0.30% NATU3 8.14 ▼ 0.73% IBOV 205,430.33 ▲ 0.54% IPSA 10,969.16 ▼ 0.02% IPC MEX 68,929.72 ▲ 1.87% MERVAL 2,848,945 ▼ 0.35% COLCAP 2,566.28 ▼ 0.55% BVL PERÚ 60,210.69 ▼ 0.91% USD/BRL 5.16 ▲ 0.01% USD/MXN 17.06 ▼ 0.24% USD/CLP 913.98 ▲ 0.04% USD/COP 3,140 ▲ 0.03% USD/PEN 3.36 ▼ 0.66% USD/ARS 1,493 ▲ 0.10% USD/UYU 40.27 ▲ 1.24% USD/PYG 5,939 ▲ 1.68% USD/BOB 11.64 ▼ 0.76% USD/DOP 58.34 ▲ 1.25% USD/CRC 445.92 ▲ 0.89% USD/GTQ 7.62 ▲ 2.21% USD/HNL 26.79 ▲ 1.57% USD/NIO 36.62 ▲ 0.69% USD/VES 762.44 ▼ 0.13% USD/PAB 1.00 — 0.00% USD/BZD 2.00 — 0.00% USD/JMD 157.28 — 0.00% USD/TTD 6.70 ▲ 0.61% EUR/BRL 5.95 ▲ 1.01% BRENT 88.88 ▼ 0.03% WTI 83.11 ▼ 0.11% IRON ORE 161.91 — — COPPER 6.61 ▲ 0.03% GOLD 4,461 ▲ 1.78% SILVER 65.59 ▲ 1.26% SOY 1,184 ▲ 3.20% CORN 480.50 ▲ 10.02% WHEAT 655.00 ▲ 3.93% COFFEE 317.25 ▼ 5.51% SUGAR 16.43 ▼ 1.79% ORANGE JUICE 138.55 ▼ 0.47% COTTON 85.03 ▲ 2.33% COCOA 5,719 ▲ 3.18% BEEF 223.60 ▼ 3.93% CATTLE 339.10 ▼ 3.16% LITHIUM 75.20 ▲ 1.47% PETR4 41.64 ▼ 0.05% VALE3 72.97 ▲ 0.83% ITUB4 38.60 ▼ 1.03% BBDC4 16.85 ▲ 0.36% ABEV3 14.89 ▼ 0.80% BBAS3 19.37 ▲ 0.47% B3SA3 14.26 ▼ 0.21% WEGE3 47.59 ▲ 0.49% PRIO3 59.14 ▼ 0.19% SUZB3 41.33 ▲ 2.35% RENT3 34.68 ▼ 0.09% AZZA3 15.89 ▼ 2.63% CSAN3 3.22 ▼ 1.83% RAIZ4 0.25 — 0.00% PCAR3 2.75 ▼ 0.36% GMAT3 3.65 ▼ 1.08% PSSA3 48.13 ▼ 0.54% CVCB3 1.33 ▼ 2.92% POSI3 3.36 ▲ 2.44% SLCE3 13.34 ▲ 0.30% NATU3 8.14 ▼ 0.73%
since 2009
Saturday, October 17, 2026

Where Real Wealth Lives: The Countries Where Money Goes Furthest

By · July 22, 2025 · 2 min read

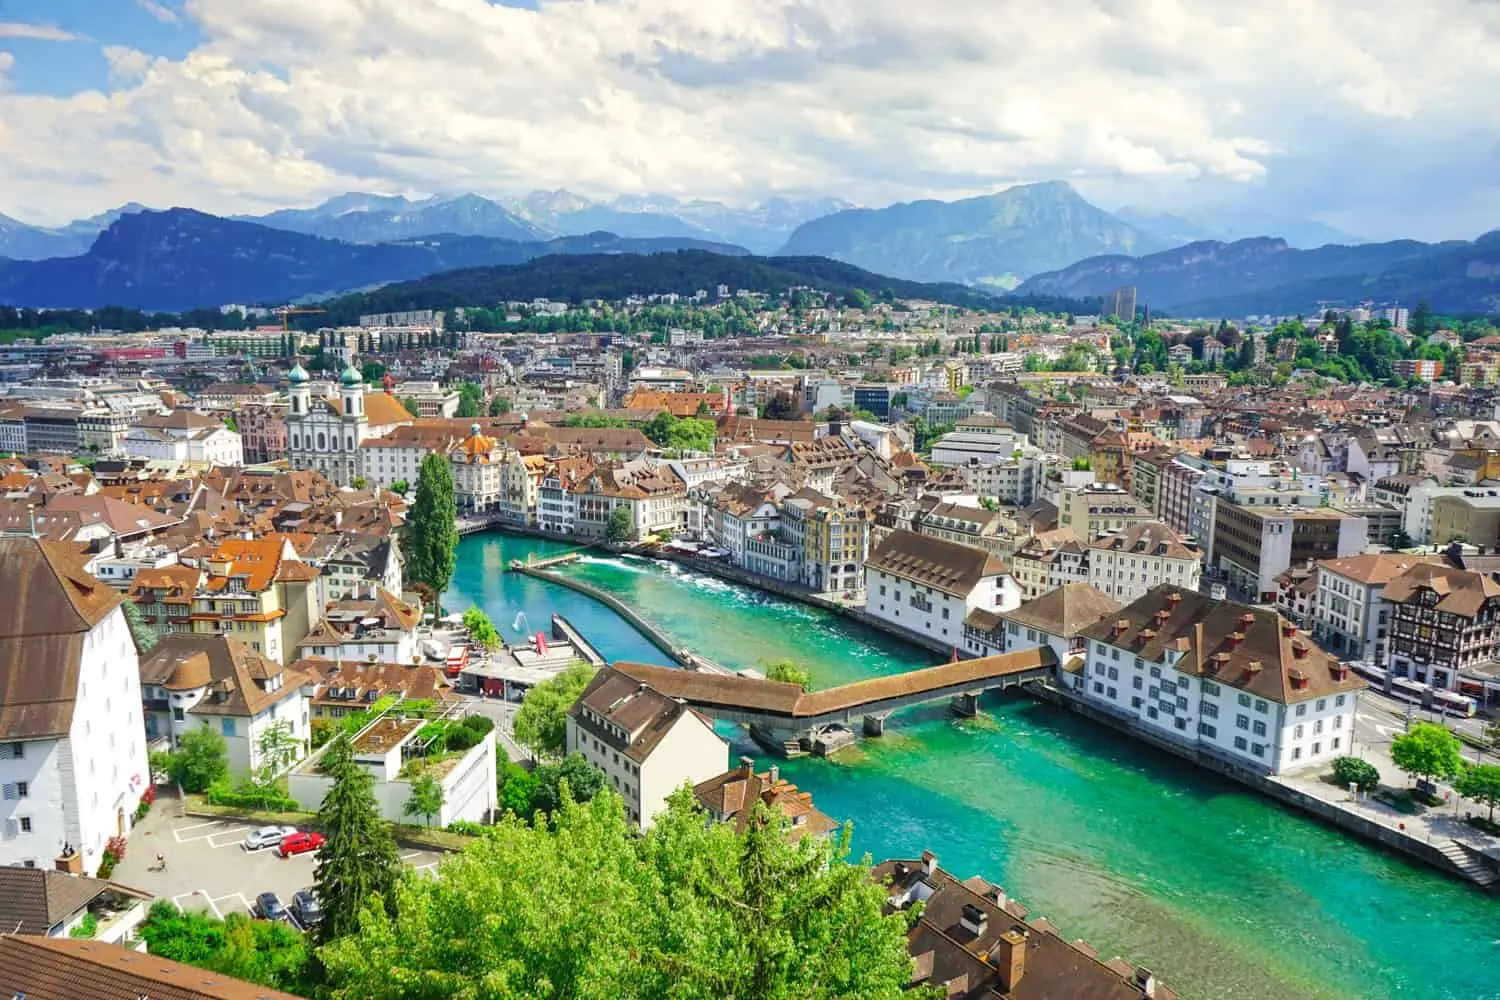
Official government and global economic data reveal that high average incomes do not always translate into a comfortable life. Switzerland leads with an average income of over $104,000 per person, according to Swiss government and IMF figures.

Yet Swiss residents also face the world’s highest cost of living. Everyday expenses such as rent, groceries, and health care quickly eat into those big paychecks, leaving less money for personal spending than the big numbers suggest.

Singapore and Norway tell different stories with the same lesson. Singapore shows high average incomes—nearly $93,000 per person, as government data confirm—but stands out more because living costs are lower than in Switzerland.

For companies and workers, this means a paycheck in Singapore typically covers more real-world expenses. Norway, by contrast, gains an edge because of its short working weeks and high public service levels.

Norwegian workers do not just get paid well—they work fewer hours and receive more government support, all backed by extensive state wealth from oil and energy exports.
Where Real Wealth Lives: The Countries Where Money Goes Furthest
Where Real Wealth Lives: The Countries Where Money Goes Furthest.
RT
Ask Rio Times
17 years of Latin America reporting, on demand.
Open the full Ask Rio Times →

Not all countries at the top of the income list offer the same reality for residents. Luxembourg, for example, leads some rankings, but many of its high earners actually live in neighboring countries, skewing the numbers for those who reside full-time.

The LatAm Brief

One email, every weekday morning. What moved in Latin American markets, politics and expat life.

Yesterday’s subject line: “US avoids pledge to accept Brazil election result”

Free. We send a confirmation link first — nothing arrives until you click it. Unsubscribe with one click in any edition. If you stop opening us for 30 days we stop sending by ourselves, as we assume the interest is no longer there. See our privacy policy. We never share your email.

Why GDP Alone Doesn’t Tell the Whole Story

Ireland faces a similar issue, which authorities address by using new measures focused on citizen income instead of simple GDP. Emerging economies show how fast fortunes can change.

Guyana climbed rapidly up world rankings after a jump in oil production, posting an income growth of more than 40% in a single year, according to its finance ministry. Yet that boom depends on a volatile resource market.

Meanwhile, countries like Burundi illustrate the other side of the coin. Burundi’s average income is less than $160 per person per year by IMF data, and its young population faces real limits even when prices are low.

Numbers from government agencies, the IMF, and the OECD make one point clear for both investors and workers: High salaries only truly matter when they hold up against everyday prices.

Therefore, international companies and anyone considering moving abroad should look beyond headlines and focus on what those salaries actually buy.

All data here is verified against official government sources and international economic bodies, with no speculation or unconfirmed figures.

This article was produced by The Rio Times’ automated newsroom system. How we use AI · Report an error · Editorial responsibility: Matthias Camenzind, Editor-in-Chief

Read More from The Rio Times

The Rio Times · Power Map
See who really holds power in Latin America
Click to open the Power Map →

Rotate for Best Experience

This report is optimized for landscape viewing. Rotate your phone for the full experience.