IBOV 205,430.33 ▲ 0.54% IPSA 10,969.16 ▼ 0.02% IPC MEX 68,420.16 ▲ 1.12% MERVAL 2,848,945 ▼ 0.35% COLCAP 2,566.28 ▼ 0.55% BVL PERÚ 60,210.69 ▼ 0.91% USD/BRL5.07▼ 0.54% USD/MXN18.48▲ 0.36% USD/CLP984.38▲ 0.32% USD/COP3,171▼ 0.77% USD/PEN3.43▼ 0.11% USD/ARS1,518▲ 0.30% USD/UYU40.13▲ 3.08% USD/PYG5,686▲ 3.07% USD/BOB11.61▲ 2.27% USD/DOP61.26▲ 0.43% USD/CRC448.47▲ 1.59% USD/GTQ7.65▲ 3.30% USD/HNL26.86▲ 0.34% USD/NIO36.62▲ 2.76% USD/VES877.92▼ 0.13% USD/PAB1.00— 0.00% USD/BZD2.00— 0.00% USD/JMD 157.28 — 0.00% USD/TTD6.73▲ 2.13% EUR/BRL5.71▲ 1.16% BRENT 88.88 ▼ 0.03% WTI 83.11 ▼ 0.11% IRON ORE 161.91 — — COPPER 6.61 ▲ 0.03% GOLD 4,461 ▲ 1.78% SILVER 65.59 ▲ 1.26% SOY 1,184 ▲ 3.20% CORN 480.50 ▲ 10.02% WHEAT 655.00 ▲ 3.93% COFFEE 317.25 ▼ 5.51% SUGAR 16.43 ▼ 1.79% ORANGE JUICE 138.55 ▼ 0.47% COTTON 85.03 ▲ 2.33% COCOA 5,719 ▲ 3.18% BEEF 223.60 ▼ 3.93% CATTLE 339.10 ▼ 3.16% LITHIUM 75.20 ▲ 1.47% PETR4 41.64 ▼ 0.05% VALE3 72.97 ▲ 0.83% ITUB4 38.60 ▼ 1.03% BBDC4 16.85 ▲ 0.36% ABEV3 14.89 ▼ 0.80% BBAS3 19.37 ▲ 0.47% B3SA3 14.26 ▼ 0.21% WEGE3 47.59 ▲ 0.49% PRIO3 59.14 ▼ 0.19% SUZB3 41.33 ▲ 2.35% RENT3 34.68 ▼ 0.09% AZZA3 15.89 ▼ 2.63% CSAN3 3.22 ▼ 1.83% RAIZ4 0.25 — 0.00% PCAR3 2.75 ▼ 0.36% GMAT3 3.65 ▼ 1.08% PSSA3 48.13 ▼ 0.54% CVCB3 1.33 ▼ 2.92% POSI3 3.36 ▲ 2.44% SLCE3 13.34 ▲ 0.30% NATU3 8.14 ▼ 0.73% IBOV 205,430.33 ▲ 0.54% IPSA 10,969.16 ▼ 0.02% IPC MEX 68,420.16 ▲ 1.12% MERVAL 2,848,945 ▼ 0.35% COLCAP 2,566.28 ▼ 0.55% BVL PERÚ 60,210.69 ▼ 0.91% USD/BRL 5.16 ▲ 0.01% USD/MXN 17.06 ▼ 0.24% USD/CLP 913.98 ▲ 0.04% USD/COP 3,140 ▲ 0.03% USD/PEN 3.36 ▼ 0.66% USD/ARS 1,493 ▲ 0.10% USD/UYU 40.27 ▲ 1.24% USD/PYG 5,939 ▲ 1.68% USD/BOB 11.64 ▼ 0.76% USD/DOP 58.34 ▲ 1.25% USD/CRC 445.92 ▲ 0.89% USD/GTQ 7.62 ▲ 2.21% USD/HNL 26.79 ▲ 1.57% USD/NIO 36.62 ▲ 0.69% USD/VES 762.44 ▼ 0.13% USD/PAB 1.00 — 0.00% USD/BZD 2.00 — 0.00% USD/JMD 157.28 — 0.00% USD/TTD 6.70 ▲ 0.61% EUR/BRL 5.95 ▲ 1.01% BRENT 88.88 ▼ 0.03% WTI 83.11 ▼ 0.11% IRON ORE 161.91 — — COPPER 6.61 ▲ 0.03% GOLD 4,461 ▲ 1.78% SILVER 65.59 ▲ 1.26% SOY 1,184 ▲ 3.20% CORN 480.50 ▲ 10.02% WHEAT 655.00 ▲ 3.93% COFFEE 317.25 ▼ 5.51% SUGAR 16.43 ▼ 1.79% ORANGE JUICE 138.55 ▼ 0.47% COTTON 85.03 ▲ 2.33% COCOA 5,719 ▲ 3.18% BEEF 223.60 ▼ 3.93% CATTLE 339.10 ▼ 3.16% LITHIUM 75.20 ▲ 1.47% PETR4 41.64 ▼ 0.05% VALE3 72.97 ▲ 0.83% ITUB4 38.60 ▼ 1.03% BBDC4 16.85 ▲ 0.36% ABEV3 14.89 ▼ 0.80% BBAS3 19.37 ▲ 0.47% B3SA3 14.26 ▼ 0.21% WEGE3 47.59 ▲ 0.49% PRIO3 59.14 ▼ 0.19% SUZB3 41.33 ▲ 2.35% RENT3 34.68 ▼ 0.09% AZZA3 15.89 ▼ 2.63% CSAN3 3.22 ▼ 1.83% RAIZ4 0.25 — 0.00% PCAR3 2.75 ▼ 0.36% GMAT3 3.65 ▼ 1.08% PSSA3 48.13 ▼ 0.54% CVCB3 1.33 ▼ 2.92% POSI3 3.36 ▲ 2.44% SLCE3 13.34 ▲ 0.30% NATU3 8.14 ▼ 0.73%
since 2009
Saturday, October 17, 2026

U.S. Oil’s Global Ascent

By · March 31, 2024 · 2 min read

Amid sanctions on Russian and Venezuelan oil, U.S. suppliers are making significant inroads into markets once led by OPEC+.

Western sanctions against Russia in 2022 propelled U.S. oil exports to record highs, with five new monthly records established.

As restrictions on Venezuela loom, U.S. oil is increasingly replacing sanctioned supplies, particularly in India, a key buyer of such oil.

These shifts highlight the role of sanctions in enhancing U.S. crude’s share in the global market.

The aftermath of Russia’s invasion of Ukraine boosted demand for U.S. oil, with exports to Europe and Asia soaring.

The LatAm Brief

One email, every weekday morning. What moved in Latin American markets, politics and expat life.

Yesterday’s subject line: “IMF sees Brazil as 8th-largest economy by 2027”

Free. We send a confirmation link first — nothing arrives until you click it. Unsubscribe with one click in any edition. If you stop opening us for 30 days we stop sending by ourselves, as we assume the interest is no longer there. See our privacy policy. We never share your email.

This surge aligns with peak U.S. production and OPEC+‘s reduced supply, elevating U.S. presence in foreign markets.

Consequently, prices for WTI in Houston and the Mars benchmark have hit recent highs.
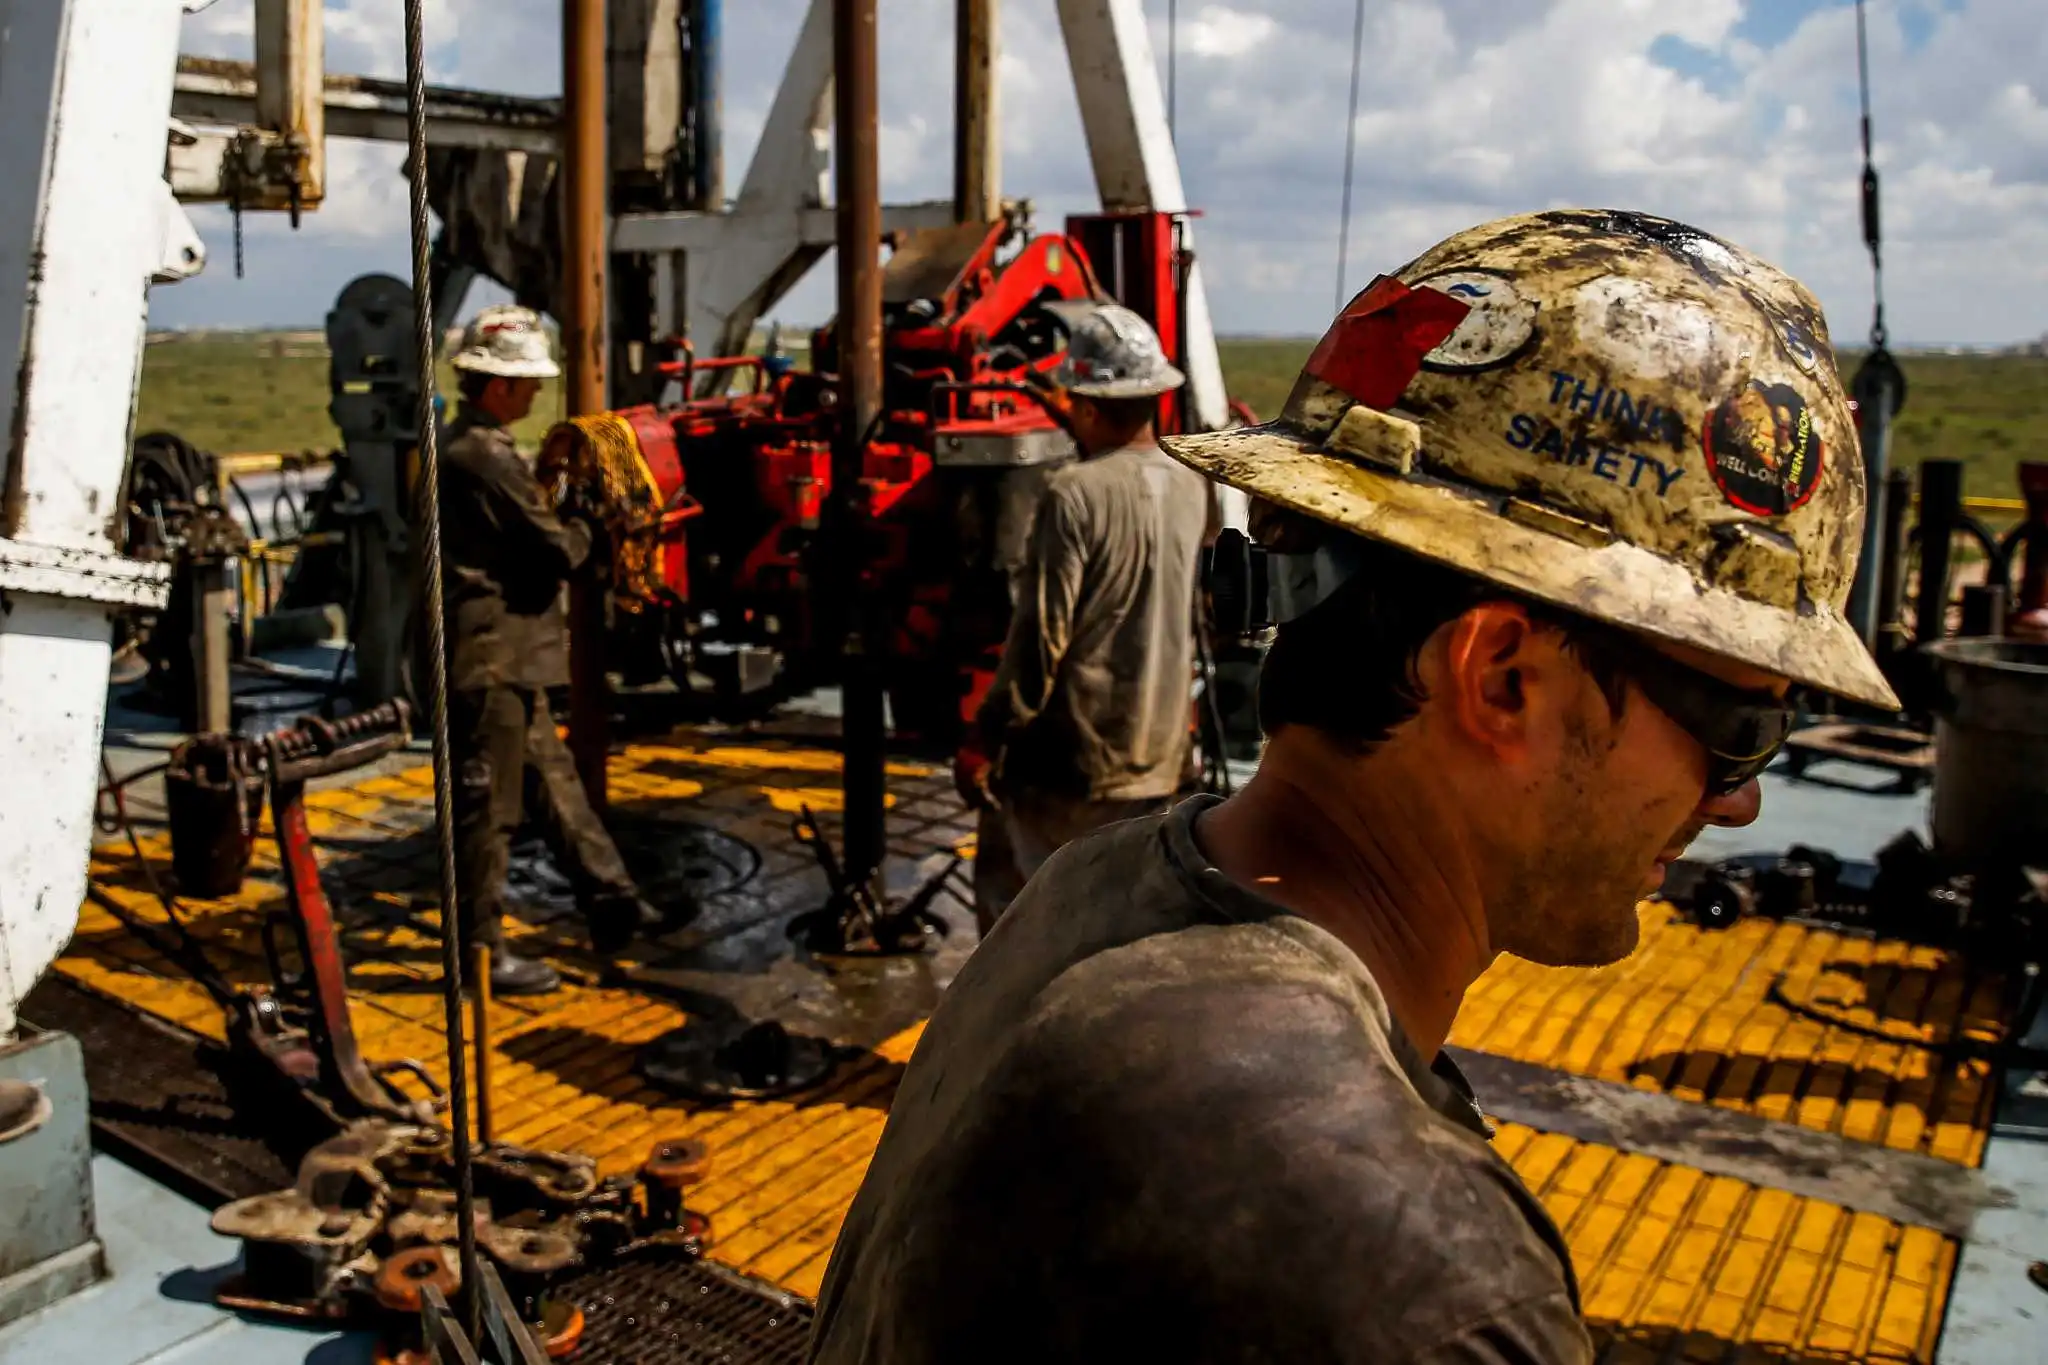
U.S. Oil's Global Ascent.
U.S. Oil’s Global Ascent.
One-stop reference
Company Intelligence
Every listed company in Latin America — financials, ownership and structure for 1,450+ companies across 26 exchanges, in one place.
Browse the directory →
RT
Ask Rio Times
Latin American markets, currencies and companies.
Open the full Ask Rio Times →

Gary Ross of Black Gold Investors LLC points out to Bloomberg that the U.S.’s market share growth increases as its production increases and OPEC and Russia’s output declines.

India’s increased U.S. oil imports, reaching a nearly year-high this March according to Kpler, illustrates this trend.

With Russian oil imports dropping, partly due to Indian refineries rejecting cargoes from sanctioned Sovcomflot PJSC, there’s a clear pivot towards U.S. crude.

Though U.S. oil can’t wholly replace Russian crude due to quality and logistical differences, its appeal is undeniable.

Cutting back on Venezuelan oil

Moreover, Indian refineries are cutting back on Venezuelan oil before a U.S. sanction exemption expiration.

Before these developments, the U.S. had already solidified its status as a major supplier to Asia, with record imports last year, as reported by the EIA.

In Europe, U.S. oil shipments are expected to reach an all-time high in March. This surge, partly driven by sanctions and strategic market positions, significantly boosted imports to countries like France and Spain.

As U.S. production keeps rising, Matt Smith from Kpler predicts an increase in exports, highlighting the U.S.’s expanding global oil influence.

This article was produced by The Rio Times’ automated newsroom system. How we use AI · Report an error · Editorial responsibility: Matthias Camenzind, Editor-in-Chief

LatAm Markets: Live Signals → — real-time movers, turnover leaders and FX across Latin America.

Read More from The Rio Times

Rotate for Best Experience

This report is optimized for landscape viewing. Rotate your phone for the full experience.