IBOV 179,722.48 ▲ 1.30% IPSA 11,315.26 ▼ 1.14% IPC MEX 65,314.78 ▼ 0.18% MERVAL 3,049,455 ▲ 0.51% COLCAP 2,470.26 ▲ 1.86% BVL PERÚ 59,450.29 ▲ 0.11% USD/BRL5.15▼ 0.60% USD/MXN17.00▲ 0.06% USD/CLP936.45▲ 0.24% USD/COP3,162▼ 1.23% USD/PEN3.36▼ 0.08% USD/ARS1,513▲ 0.25% USD/UYU40.24▲ 0.68% USD/PYG5,873▲ 0.47% USD/BOB12.08▲ 3.98% USD/DOP58.56▲ 0.38% USD/CRC446.47▲ 1.09% USD/GTQ7.62▲ 1.63% USD/HNL26.84▲ 1.11% USD/NIO36.62▲ 0.14% USD/VES799.17▲ 0.23% USD/PAB1.00— 0.00% USD/BZD2.00— 0.00% USD/JMD 157.28 — 0.00% USD/TTD6.69▼ 0.06% EUR/BRL5.97▼ 0.70% BRENT 88.88 ▼ 0.03% WTI 83.11 ▼ 0.11% IRON ORE 161.91 — — COPPER 6.61 ▲ 0.03% GOLD 4,461 ▲ 1.78% SILVER 65.59 ▲ 1.26% SOY 1,184 ▲ 3.20% CORN 480.50 ▲ 10.02% WHEAT 655.00 ▲ 3.93% COFFEE 317.25 ▼ 5.51% SUGAR 16.43 ▼ 1.79% ORANGE JUICE 138.55 ▼ 0.47% COTTON 85.03 ▲ 2.33% COCOA 5,719 ▲ 3.18% BEEF 223.60 ▼ 3.93% CATTLE 339.10 ▼ 3.16% LITHIUM 75.20 ▲ 1.47% PETR4 41.64 ▼ 0.05% VALE3 72.97 ▲ 0.83% ITUB4 38.60 ▼ 1.03% BBDC4 16.85 ▲ 0.36% ABEV3 14.89 ▼ 0.80% BBAS3 19.37 ▲ 0.47% B3SA3 14.26 ▼ 0.21% WEGE3 47.59 ▲ 0.49% PRIO3 59.14 ▼ 0.19% SUZB3 41.33 ▲ 2.35% RENT3 34.68 ▼ 0.09% AZZA3 15.89 ▼ 2.63% CSAN3 3.22 ▼ 1.83% RAIZ4 0.25 — 0.00% PCAR3 2.75 ▼ 0.36% GMAT3 3.65 ▼ 1.08% PSSA3 48.13 ▼ 0.54% CVCB3 1.33 ▼ 2.92% POSI3 3.36 ▲ 2.44% SLCE3 13.34 ▲ 0.30% NATU3 8.14 ▼ 0.73% IBOV 179,722.48 ▲ 1.30% IPSA 11,315.26 ▼ 1.14% IPC MEX 65,314.78 ▼ 0.18% MERVAL 3,049,455 ▲ 0.51% COLCAP 2,470.26 ▲ 1.86% BVL PERÚ 59,450.29 ▲ 0.11% USD/BRL 5.16 ▲ 0.01% USD/MXN 17.06 ▼ 0.24% USD/CLP 913.98 ▲ 0.04% USD/COP 3,140 ▲ 0.03% USD/PEN 3.36 ▼ 0.66% USD/ARS 1,493 ▲ 0.10% USD/UYU 40.27 ▲ 1.24% USD/PYG 5,939 ▲ 1.68% USD/BOB 11.64 ▼ 0.76% USD/DOP 58.34 ▲ 1.25% USD/CRC 445.92 ▲ 0.89% USD/GTQ 7.62 ▲ 2.21% USD/HNL 26.79 ▲ 1.57% USD/NIO 36.62 ▲ 0.69% USD/VES 762.44 ▼ 0.13% USD/PAB 1.00 — 0.00% USD/BZD 2.00 — 0.00% USD/JMD 157.28 — 0.00% USD/TTD 6.70 ▲ 0.61% EUR/BRL 5.95 ▲ 1.01% BRENT 88.88 ▼ 0.03% WTI 83.11 ▼ 0.11% IRON ORE 161.91 — — COPPER 6.61 ▲ 0.03% GOLD 4,461 ▲ 1.78% SILVER 65.59 ▲ 1.26% SOY 1,184 ▲ 3.20% CORN 480.50 ▲ 10.02% WHEAT 655.00 ▲ 3.93% COFFEE 317.25 ▼ 5.51% SUGAR 16.43 ▼ 1.79% ORANGE JUICE 138.55 ▼ 0.47% COTTON 85.03 ▲ 2.33% COCOA 5,719 ▲ 3.18% BEEF 223.60 ▼ 3.93% CATTLE 339.10 ▼ 3.16% LITHIUM 75.20 ▲ 1.47% PETR4 41.64 ▼ 0.05% VALE3 72.97 ▲ 0.83% ITUB4 38.60 ▼ 1.03% BBDC4 16.85 ▲ 0.36% ABEV3 14.89 ▼ 0.80% BBAS3 19.37 ▲ 0.47% B3SA3 14.26 ▼ 0.21% WEGE3 47.59 ▲ 0.49% PRIO3 59.14 ▼ 0.19% SUZB3 41.33 ▲ 2.35% RENT3 34.68 ▼ 0.09% AZZA3 15.89 ▼ 2.63% CSAN3 3.22 ▼ 1.83% RAIZ4 0.25 — 0.00% PCAR3 2.75 ▼ 0.36% GMAT3 3.65 ▼ 1.08% PSSA3 48.13 ▼ 0.54% CVCB3 1.33 ▼ 2.92% POSI3 3.36 ▲ 2.44% SLCE3 13.34 ▲ 0.30% NATU3 8.14 ▼ 0.73%
since 2009
Wednesday, September 2, 2026

Brazil Business - Brazil

U.S. Dominates Brazilian Foreign Investment, Focusing on Green Sector

By · November 6, 2024 · 2 min read

Daily Brief

The morning intel from across Latin America. Free.

By subscribing you agree to our privacy policy. We never share your email.

The United States has solidified its position as Brazil’s primary foreign investor, with a significant shift towards green economy projects.

American companies announced 126 new greenfield projects in Brazil during 2023, totaling $7.3 billion in investments. This trend marks a notable change in the investment landscape between the two nations.

Renewable energy has emerged as a key focus area for US investments in Brazil. Approximately $2.4 billion was directed toward wind and solar energy projects.

These investments align with long-term climate goals and bolster Brazil’s contribution to global sustainable development and energy security.

Major multinational corporations have shown keen interest in Brazil’s energy sector. AES and New Generation Power announced projects exceeding $2 billion in investments.
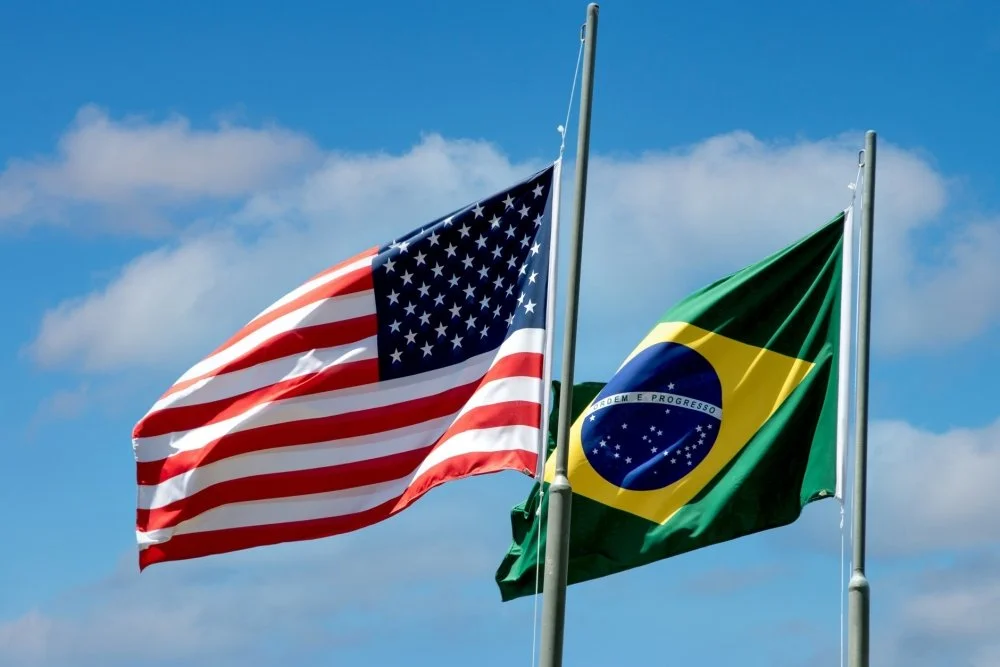
U.S. Dominates Brazilian Foreign Investment, Focusing on Green Sector
U.S. Dominates Brazilian Foreign Investment, Focusing on Green Sector. (Photo Internet reproduction)
One-stop reference
Company Intelligence
Every listed company in Latin America — financials, ownership and structure for 1,450+ companies across 26 exchanges, in one place.
Browse the directory →
RT
Ask Rio Times
Latin American markets, currencies and companies.
Open the full Ask Rio Times →

The availability of reliable energy and Brazil‘s growing digital market have made the country an attractive destination for such investments.

AES, currently in merger talks with Auren, had previously acquired wind farm complexes in Brazil. This acquisition, valued at R$2.03 billion ($356 million), further demonstrates the company’s commitment to the Brazilian market.

US Direct Investment in Brazil

The United States, responsible for 26.1% of the global GDP in 2023 ($27.4 trillion), has increased its direct investment in Brazil over the past decade.

From 2013 to 2022, US investments in Brazil grew from $69.7 billion to $80.9 billion, representing a 16.1% increase. Despite this growth, Brazil’s share of total US foreign direct investment decreased from 1.5% to 1.2%.

The annual growth rate of US investment in Brazil slowed from 2.7% between 2013-2017 to 0.6% between 2018-2022. It’s worth noting that investment data differ between US and Brazilian sources due to methodological differences.

The Brazilian Central Bank reports higher figures, considering investments that pass through other countries before reaching Brazil. The outlook for US direct investment in Brazil remains positive, particularly in the green economy and technology sectors.

The alignment of environmental and political agendas between the two countries has positioned Brazil favorably for future investments.

Rafael Lucchesi, Industrial Development Director at the National Confederation of Industry, emphasizes the need for an active strategy to attract investments.

He believes Brazil must showcase its potential to American, European, and Chinese investors. This shift in investment patterns reflects a broader global trend towards sustainable development.

As Brazil continues to develop its renewable energy sector and digital infrastructure, it is likely to attract more foreign investments, particularly from the United States.

This article was produced by The Rio Times’ automated newsroom system. How we use AI · Report an error

Read More from The Rio Times

The Rio Times · Power Map
See who really holds power in Latin America
Click to open the Power Map

Rotate for Best Experience

This report is optimized for landscape viewing. Rotate your phone for the full experience.