IBOV 205,430.33 ▲ 0.54% IPSA 10,969.16 ▼ 0.02% IPC MEX 68,929.72 ▲ 1.87% MERVAL 2,848,945 ▼ 0.35% COLCAP 2,566.28 ▼ 0.55% BVL PERÚ 60,210.69 ▼ 0.91% USD/BRL5.07▲ 0.09% USD/MXN18.50▲ 0.45% USD/CLP984.38— 0.00% USD/COP3,171▼ 0.15% USD/PEN3.43▼ 0.11% USD/ARS1,518▲ 0.30% USD/UYU40.13▲ 3.08% USD/PYG5,686▲ 3.07% USD/BOB11.61▲ 2.27% USD/DOP61.26▲ 0.43% USD/CRC448.47▲ 1.59% USD/GTQ7.65▲ 3.30% USD/HNL26.86▲ 0.34% USD/NIO36.62▲ 2.76% USD/VES877.92▼ 0.13% USD/PAB1.00— 0.00% USD/BZD2.00— 0.00% USD/JMD 157.28 — 0.00% USD/TTD6.73▲ 2.13% EUR/BRL5.71▲ 1.16% BRENT 88.88 ▼ 0.03% WTI 83.11 ▼ 0.11% IRON ORE 161.91 — — COPPER 6.61 ▲ 0.03% GOLD 4,461 ▲ 1.78% SILVER 65.59 ▲ 1.26% SOY 1,184 ▲ 3.20% CORN 480.50 ▲ 10.02% WHEAT 655.00 ▲ 3.93% COFFEE 317.25 ▼ 5.51% SUGAR 16.43 ▼ 1.79% ORANGE JUICE 138.55 ▼ 0.47% COTTON 85.03 ▲ 2.33% COCOA 5,719 ▲ 3.18% BEEF 223.60 ▼ 3.93% CATTLE 339.10 ▼ 3.16% LITHIUM 75.20 ▲ 1.47% PETR4 41.64 ▼ 0.05% VALE3 72.97 ▲ 0.83% ITUB4 38.60 ▼ 1.03% BBDC4 16.85 ▲ 0.36% ABEV3 14.89 ▼ 0.80% BBAS3 19.37 ▲ 0.47% B3SA3 14.26 ▼ 0.21% WEGE3 47.59 ▲ 0.49% PRIO3 59.14 ▼ 0.19% SUZB3 41.33 ▲ 2.35% RENT3 34.68 ▼ 0.09% AZZA3 15.89 ▼ 2.63% CSAN3 3.22 ▼ 1.83% RAIZ4 0.25 — 0.00% PCAR3 2.75 ▼ 0.36% GMAT3 3.65 ▼ 1.08% PSSA3 48.13 ▼ 0.54% CVCB3 1.33 ▼ 2.92% POSI3 3.36 ▲ 2.44% SLCE3 13.34 ▲ 0.30% NATU3 8.14 ▼ 0.73% IBOV 205,430.33 ▲ 0.54% IPSA 10,969.16 ▼ 0.02% IPC MEX 68,929.72 ▲ 1.87% MERVAL 2,848,945 ▼ 0.35% COLCAP 2,566.28 ▼ 0.55% BVL PERÚ 60,210.69 ▼ 0.91% USD/BRL 5.16 ▲ 0.01% USD/MXN 17.06 ▼ 0.24% USD/CLP 913.98 ▲ 0.04% USD/COP 3,140 ▲ 0.03% USD/PEN 3.36 ▼ 0.66% USD/ARS 1,493 ▲ 0.10% USD/UYU 40.27 ▲ 1.24% USD/PYG 5,939 ▲ 1.68% USD/BOB 11.64 ▼ 0.76% USD/DOP 58.34 ▲ 1.25% USD/CRC 445.92 ▲ 0.89% USD/GTQ 7.62 ▲ 2.21% USD/HNL 26.79 ▲ 1.57% USD/NIO 36.62 ▲ 0.69% USD/VES 762.44 ▼ 0.13% USD/PAB 1.00 — 0.00% USD/BZD 2.00 — 0.00% USD/JMD 157.28 — 0.00% USD/TTD 6.70 ▲ 0.61% EUR/BRL 5.95 ▲ 1.01% BRENT 88.88 ▼ 0.03% WTI 83.11 ▼ 0.11% IRON ORE 161.91 — — COPPER 6.61 ▲ 0.03% GOLD 4,461 ▲ 1.78% SILVER 65.59 ▲ 1.26% SOY 1,184 ▲ 3.20% CORN 480.50 ▲ 10.02% WHEAT 655.00 ▲ 3.93% COFFEE 317.25 ▼ 5.51% SUGAR 16.43 ▼ 1.79% ORANGE JUICE 138.55 ▼ 0.47% COTTON 85.03 ▲ 2.33% COCOA 5,719 ▲ 3.18% BEEF 223.60 ▼ 3.93% CATTLE 339.10 ▼ 3.16% LITHIUM 75.20 ▲ 1.47% PETR4 41.64 ▼ 0.05% VALE3 72.97 ▲ 0.83% ITUB4 38.60 ▼ 1.03% BBDC4 16.85 ▲ 0.36% ABEV3 14.89 ▼ 0.80% BBAS3 19.37 ▲ 0.47% B3SA3 14.26 ▼ 0.21% WEGE3 47.59 ▲ 0.49% PRIO3 59.14 ▼ 0.19% SUZB3 41.33 ▲ 2.35% RENT3 34.68 ▼ 0.09% AZZA3 15.89 ▼ 2.63% CSAN3 3.22 ▼ 1.83% RAIZ4 0.25 — 0.00% PCAR3 2.75 ▼ 0.36% GMAT3 3.65 ▼ 1.08% PSSA3 48.13 ▼ 0.54% CVCB3 1.33 ▼ 2.92% POSI3 3.36 ▲ 2.44% SLCE3 13.34 ▲ 0.30% NATU3 8.14 ▼ 0.73%
since 2009
Saturday, October 17, 2026

North America World-News

TSMC’s $165 Billion U.S. Bet: Chips, Tariffs, and the New Industrial Order

By · April 20, 2025 · 2 min read

TSMC, the world’s largest contract chipmaker, has committed to a $165 billion expansion in the United States, as confirmed in company statements and official U.S. government releases.

The plan, announced jointly by TSMC CEO C.C. Wei and President Trump at the White House, will see the construction of three new semiconductor fabrication plants, two advanced packaging facilities, and a research center in Arizona.

This marks the largest single foreign direct investment in U.S. history. TSMC’s move is not just a business decision. The company aims to sidestep tariffs of up to 100% on imported chips, a threat made explicit by the Trump administration.

By localizing advanced chip production, TSMC ensures continued access to its biggest clients—Apple, Nvidia, AMD, Broadcom, and Qualcomm—who have demanded more stable, domestic supply chains.

The first Arizona plant began producing 4-nanometer chips in late 2024. The second plant, set to open in 2028, will manufacture 2-nanometer chips, with a third fab planned for even more advanced technology by decade’s end.
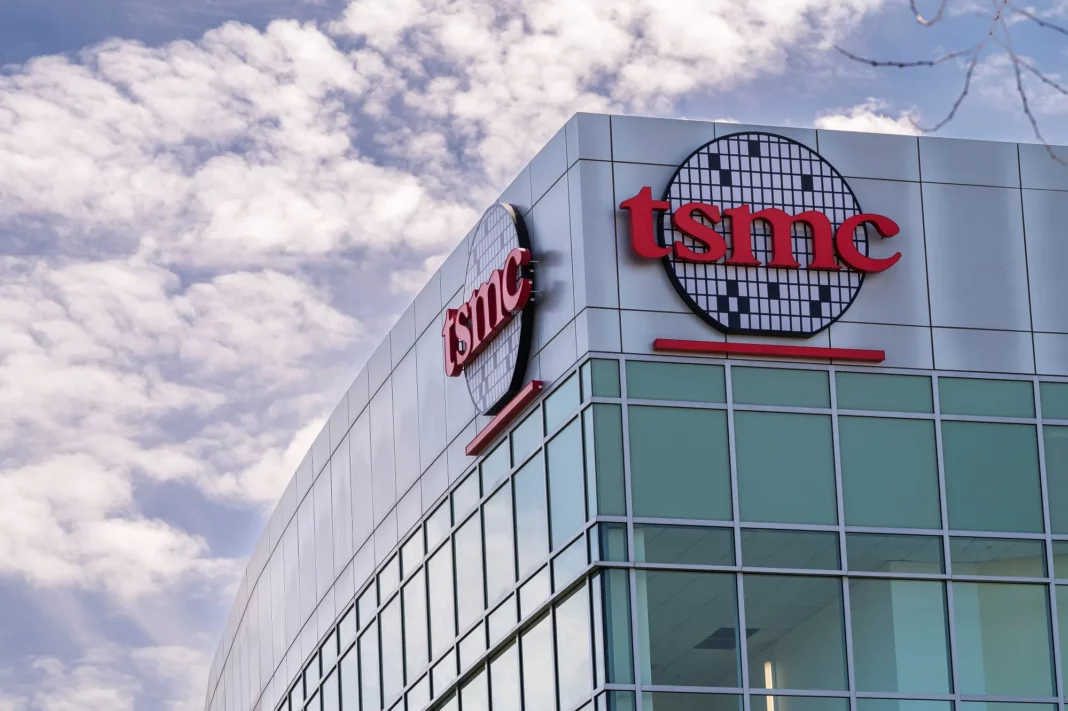
TSMC’s $165 Billion U.S. Bet: Chips, Tariffs, and the New Industrial Order
TSMC’s $165 Billion U.S. Bet: Chips, Tariffs, and the New Industrial Order.
RT
Ask Rio Times
17 years of Latin America reporting, on demand.
Open the full Ask Rio Times →

This investment will create 6,000 high-tech jobs and over 20,000 construction jobs in Arizona, with economic output projected to exceed $200 billion over the next decade.

The LatAm Brief

One email, every weekday morning. What moved in Latin American markets, politics and expat life.

Yesterday’s subject line: “US avoids pledge to accept Brazil election result”

Free. We send a confirmation link first — nothing arrives until you click it. Unsubscribe with one click in any edition. If you stop opening us for 30 days we stop sending by ourselves, as we assume the interest is no longer there. See our privacy policy. We never share your email.

Strategic Shift Amid Rising Geopolitical Stakes

TSMC’s U.S. expansion will supply about 30% of its most advanced chips from Arizona, a significant shift from its traditional Taiwan-centric model. The U.S. will hold an estimated 22% of global advanced chip capacity by 2030, up from just 10% today.

However, the costs of U.S. production run 25% to 30% higher than in Taiwan. TSMC’s clients have accepted these premiums to ensure supply security.

Despite the U.S. push, TSMC will keep its most advanced R&D and the majority of its manufacturing in Taiwan, maintaining the island’s leverage in the global chip market.

This expansion is less about global cooperation and more about hard-nosed risk management. TSMC’s move hedges against political uncertainty, tariff threats, and supply chain shocks.

It also signals a shift in the balance of power in the semiconductor industry, as the U.S. uses policy and tariffs to force critical manufacturing back onto its own soil.

TSMC’s U.S. bet is a strategic response to a world where chips have become bargaining chips in international trade and security.

This article was produced by The Rio Times’ automated newsroom system. How we use AI · Report an error · Editorial responsibility: Matthias Camenzind, Editor-in-Chief

The Rio Times · Power Map
See who really holds power in Latin America
Click to open the Power Map →

Rotate for Best Experience

This report is optimized for landscape viewing. Rotate your phone for the full experience.