IBOV 204,626.74 ▲ 0.15% IPSA 10,944.69 ▼ 0.25% IPC MEX 67,663.29 ▲ 1.31% MERVAL 2,848,932 ▼ 0.35% COLCAP 2,577.69 ▼ 0.11% BVL PERÚ 60,210.69 ▼ 0.11% USD/BRL5.07▼ 0.57% USD/MXN18.50▲ 0.49% USD/CLP984.40▲ 0.32% USD/COP3,167▼ 0.87% USD/PEN3.44▼ 0.07% USD/ARS1,518▲ 0.30% USD/UYU40.13▲ 3.08% USD/PYG5,686▲ 3.07% USD/BOB11.61▲ 2.27% USD/DOP61.26▲ 0.43% USD/CRC448.47▲ 1.59% USD/GTQ7.65▲ 3.30% USD/HNL26.86▲ 0.34% USD/NIO36.62▼ 0.07% USD/VES877.92▼ 0.13% USD/PAB1.00— 0.00% USD/BZD2.00— 0.00% USD/JMD 157.28 — 0.00% USD/TTD6.73▲ 2.13% EUR/BRL5.69▲ 0.96% BRENT 88.88 ▼ 0.03% WTI 83.11 ▼ 0.11% IRON ORE 161.91 — — COPPER 6.61 ▲ 0.03% GOLD 4,461 ▲ 1.78% SILVER 65.59 ▲ 1.26% SOY 1,184 ▲ 3.20% CORN 480.50 ▲ 10.02% WHEAT 655.00 ▲ 3.93% COFFEE 317.25 ▼ 5.51% SUGAR 16.43 ▼ 1.79% ORANGE JUICE 138.55 ▼ 0.47% COTTON 85.03 ▲ 2.33% COCOA 5,719 ▲ 3.18% BEEF 223.60 ▼ 3.93% CATTLE 339.10 ▼ 3.16% LITHIUM 75.20 ▲ 1.47% PETR4 41.64 ▼ 0.05% VALE3 72.97 ▲ 0.83% ITUB4 38.60 ▼ 1.03% BBDC4 16.85 ▲ 0.36% ABEV3 14.89 ▼ 0.80% BBAS3 19.37 ▲ 0.47% B3SA3 14.26 ▼ 0.21% WEGE3 47.59 ▲ 0.49% PRIO3 59.14 ▼ 0.19% SUZB3 41.33 ▲ 2.35% RENT3 34.68 ▼ 0.09% AZZA3 15.89 ▼ 2.63% CSAN3 3.22 ▼ 1.83% RAIZ4 0.25 — 0.00% PCAR3 2.75 ▼ 0.36% GMAT3 3.65 ▼ 1.08% PSSA3 48.13 ▼ 0.54% CVCB3 1.33 ▼ 2.92% POSI3 3.36 ▲ 2.44% SLCE3 13.34 ▲ 0.30% NATU3 8.14 ▼ 0.73% IBOV 204,626.74 ▲ 0.15% IPSA 10,944.69 ▼ 0.25% IPC MEX 67,663.29 ▲ 1.31% MERVAL 2,848,932 ▼ 0.35% COLCAP 2,577.69 ▼ 0.11% BVL PERÚ 60,210.69 ▼ 0.11% USD/BRL 5.16 ▲ 0.01% USD/MXN 17.06 ▼ 0.24% USD/CLP 913.98 ▲ 0.04% USD/COP 3,140 ▲ 0.03% USD/PEN 3.36 ▼ 0.66% USD/ARS 1,493 ▲ 0.10% USD/UYU 40.27 ▲ 1.24% USD/PYG 5,939 ▲ 1.68% USD/BOB 11.64 ▼ 0.76% USD/DOP 58.34 ▲ 1.25% USD/CRC 445.92 ▲ 0.89% USD/GTQ 7.62 ▲ 2.21% USD/HNL 26.79 ▲ 1.57% USD/NIO 36.62 ▲ 0.69% USD/VES 762.44 ▼ 0.13% USD/PAB 1.00 — 0.00% USD/BZD 2.00 — 0.00% USD/JMD 157.28 — 0.00% USD/TTD 6.70 ▲ 0.61% EUR/BRL 5.95 ▲ 1.01% BRENT 88.88 ▼ 0.03% WTI 83.11 ▼ 0.11% IRON ORE 161.91 — — COPPER 6.61 ▲ 0.03% GOLD 4,461 ▲ 1.78% SILVER 65.59 ▲ 1.26% SOY 1,184 ▲ 3.20% CORN 480.50 ▲ 10.02% WHEAT 655.00 ▲ 3.93% COFFEE 317.25 ▼ 5.51% SUGAR 16.43 ▼ 1.79% ORANGE JUICE 138.55 ▼ 0.47% COTTON 85.03 ▲ 2.33% COCOA 5,719 ▲ 3.18% BEEF 223.60 ▼ 3.93% CATTLE 339.10 ▼ 3.16% LITHIUM 75.20 ▲ 1.47% PETR4 41.64 ▼ 0.05% VALE3 72.97 ▲ 0.83% ITUB4 38.60 ▼ 1.03% BBDC4 16.85 ▲ 0.36% ABEV3 14.89 ▼ 0.80% BBAS3 19.37 ▲ 0.47% B3SA3 14.26 ▼ 0.21% WEGE3 47.59 ▲ 0.49% PRIO3 59.14 ▼ 0.19% SUZB3 41.33 ▲ 2.35% RENT3 34.68 ▼ 0.09% AZZA3 15.89 ▼ 2.63% CSAN3 3.22 ▼ 1.83% RAIZ4 0.25 — 0.00% PCAR3 2.75 ▼ 0.36% GMAT3 3.65 ▼ 1.08% PSSA3 48.13 ▼ 0.54% CVCB3 1.33 ▼ 2.92% POSI3 3.36 ▲ 2.44% SLCE3 13.34 ▲ 0.30% NATU3 8.14 ▼ 0.73%
since 2009
Friday, October 16, 2026

Record $318 Trillion Global Debt Highlights Mounting Financial Pressures Worldwide

By · February 25, 2025 · 2 min read

Global debt soared to an unprecedented $318.4 trillion by the end of 2024, marking a new record for year-end figures, according to the Institute of International Finance (IIF).

This represents a $7.2 trillion increase from 2023’s $311.2 trillion, driven by rising borrowing across households, corporations, governments, and financial institutions worldwide.

Emerging markets played a significant role in this surge, with their total debt climbing to $103.7 trillion from $99.3 trillion in 2023. Advanced economies also saw a rise, reaching $214.3 trillion compared to $211.9 trillion the previous year.

Key contributors included China, India, Saudi Arabia, and Turkey among emerging markets. In developed nations, the United States, United Kingdom, Canada, and Sweden led the increases.

By sector, household debt rose marginally to $60.1 trillion from $59.7 trillion. Corporate debt increased to $91.3 trillion from $90 trillion, while government borrowing surged to $95.3 trillion from $90.8 trillion.
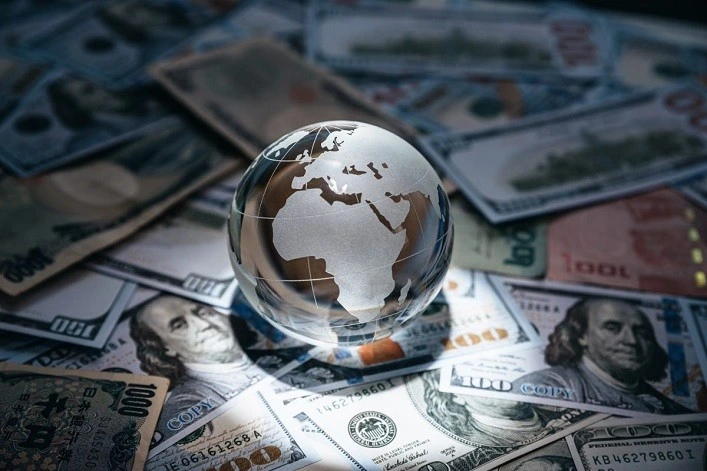
Record $318 Trillion Global Debt Highlights Mounting Financial Pressures Worldwide
Record $318 Trillion Global Debt Highlights Mounting Financial Pressures Worldwide.
RT
Ask Rio Times
17 years of Latin America reporting, on demand.
Open the full Ask Rio Times →

Financial institutions added another $71.4 trillion in liabilities, up from $70.8 trillion in 2023. The IIF highlighted that two-thirds of the global debt increase stemmed from public sector borrowing.

The LatAm Brief

One email, every weekday morning. What moved in Latin American markets, politics and expat life.

Yesterday’s subject line: “IMF sees Brazil as 8th-largest economy by 2027”

Free. We send a confirmation link first — nothing arrives until you click it. Unsubscribe with one click in any edition. If you stop opening us for 30 days we stop sending by ourselves, as we assume the interest is no longer there. See our privacy policy. We never share your email.

Global Debt Trends and Economic Implications

Government debt alone has ballooned by over 35% since pre-pandemic levels in 2019 when it stood at approximately $70 trillion. Despite the slower pace of debt growth compared to 2023—when global debt expanded by a staggering $16 trillion—the debt-to-GDP ratio rose for the first time since 2020.

It reached 328% by late 2024 due to slower economic growth and easing inflationary pressures. The report also underscored regional disparities in debt trends.

Countries like Sweden, Nigeria, China, Israel, and Saudi Arabia recorded sharp increases in their debt-to-GDP ratios. Conversely, Argentina, Turkey, Greece, Ireland, and the Netherlands saw notable declines.

Looking ahead to 2025, the IIF projects a moderation in private sector borrowing as high interest rates and global economic uncertainties curb credit demand.

However, public sector borrowing is expected to remain high, with an additional $5 trillion likely to be added globally next year. Emerging markets are forecasted to issue record liabilities of $8.2 trillion amid rising trade tensions and reduced foreign aid.

As global debt continues its upward trajectory, policymakers face mounting pressure to balance fiscal sustainability with economic growth. They must also navigate an increasingly volatile financial landscape.

This article was produced by The Rio Times’ automated newsroom system. How we use AI · Report an error · Editorial responsibility: Matthias Camenzind, Editor-in-Chief

Read More from The Rio Times

The Rio Times · Power Map
See who really holds power in Latin America
Click to open the Power Map →

Rotate for Best Experience

This report is optimized for landscape viewing. Rotate your phone for the full experience.