
Key Facts
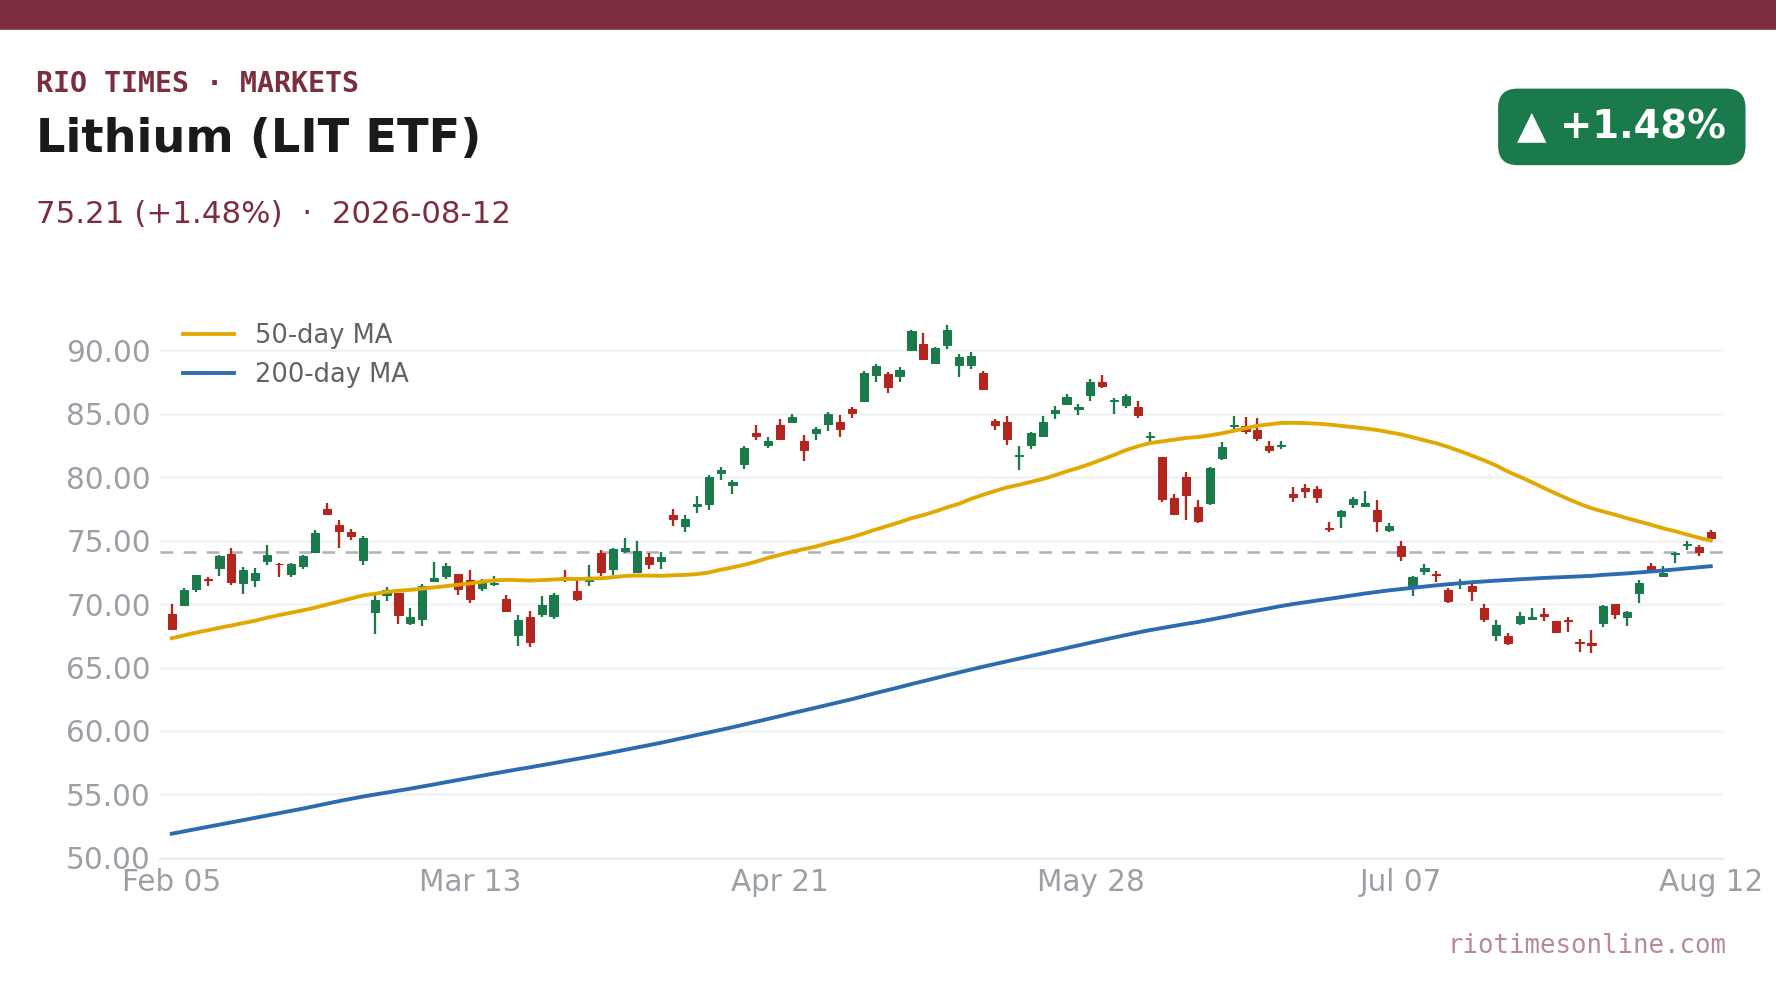
- The LIT lithium-miners ETF closed at US$75.21 a gain of 1.48 percent on Wednesday, August 12, 2026.
- Albemarle shares ended at US$128.34 down 0.79 percent in the same New York session.
- Chilean producer SQM closed at US$71.25 a decline of 1.34 percent on the day.
- The moves split the board with the diversified LIT fund rising while the two largest lithium names slipped.
- Broader markets took their cue from tame US inflation data which cooled bets on another Federal Reserve rate increase.
- Gold topped US$4,400 in New York as traders recalibrated rate expectations, offering context for commodity-linked equities.
Today’s Focus
The lithium board gave a mixed signal on Wednesday, August 12, 2026. The LIT lithium-miners ETF rose 1.48 percent to US$75.21, but the sector’s two biggest names moved the other way.
Albemarle dipped 0.79 percent to US$128.34 and Chile’s SQM fell 1.34 percent to US$71.25. The split suggests investors favoured the broader basket of miners over the two largest producers.
A tame US inflation print eased fears of another Federal Reserve rate hike, lifting gold above US$4,400 in New York. That macro shift supported many commodity-linked equities, but it did not translate into gains for Albemarle and SQM.
For readers, the lesson is that lithium exposure is not one trade. The LIT fund captures smaller producers and explorers across the Lithium Triangle, while Albemarle and SQM carry their own corporate and country-specific risks.
What matters today. The lithium trade diverged, with the broad LIT ETF rising while Albemarle and SQM fell, as tame US inflation eased rate-hike bets but did not lift the sector’s biggest producers.
01 The session in one read
Lithium assets went two ways on Wednesday, August 12, 2026. The LIT lithium-miners ETF climbed 1.48 percent to US$75.21, while the sector’s two largest stocks eased.
The divergence matters because LIT is a basket of miners and explorers, not a spot price. Its gain shows buyers were willing to add broad lithium exposure even as the biggest producers slipped.
Wednesday’s session was a reminder that lithium exposure is granular. A tame US inflation figure lifted risk appetite broadly and helped push the LIT ETF to US$75.21, but the two dominant producers closed lower. Albemarle’s 0.79 percent drop and SQM’s 1.34 percent fall point to company-specific or regional considerations, not a collapse in EV-battery demand. The variable to watch is whether SQM and Albemarle reverse higher in the next session to confirm that equities are following the ETF’s lead rather than lagging it.
02 The board
The LIT ETF closed at US$75.21, up 1.48 percent. That was the strongest print on the lithium board.
Albemarle fell 0.79 percent to US$128.34, and Chile’s SQM dropped 1.34 percent to US$71.25. Each price is a proxy: the shares and the fund track lithium miners, not the raw material itself.
| Asset | Level | Change |
|---|---|---|
| Lithium (LIT ETF) | US$75.21 | +1.48% |
| Albemarle | US$128.34 | -0.79% |
| SQM | US$71.25 | -1.34% |
Source: RT close, 2026-08-12. Where a commodity has no spot feed, an exchange-traded tracker or leading producer is shown as a labelled proxy.
Live Market IntelligenceThe live market board
Rio Times · Live Market Intelligence
Latin America — Cross-Market Board
| Instrument | Last | Change | YoY | Prev. | High | Low | Volume |
|---|---|---|---|---|---|---|---|
| IBOV | 205,430.33 | +0.54% | +21.85% | 204,324.26 | 168,310 | 167,142 | — |
| IPSA | 10,969.16 | -0.02% | — | 10,971.88 | 11,210 | 10,984 | 1,513,213,483 |
| IPC MEX | 68,929.72 | +1.87% | +12.17% | 67,663.29 | 66,121 | 65,405 | 108,886,187 |
| MERVAL | 2,848,945 | -0.35% | +30.51% | 3,022,485 | 3,042,365 | 2,991,150 | — |
| COLCAP | 2,566.28 | -0.55% | — | 9.04 | 9.05 | 9.02 | 4,133 |
| BVL PERÚ | 60,210.69 | -0.91% | — | — | — | — | — |
| USD/BRL | 5.16 | +0.01% | -5.13% | 5.16 | 5.18 | 5.14 | — |
| EUR/BRL | 5.95 | +1.01% | -5.83% | 5.89 | 5.98 | 5.94 | — |
| USD/MXN | 17.06 | -0.24% | -8.58% | 17.10 | 17.08 | 17.01 | — |
| USD/CLP | 913.98 | +0.04% | -5.67% | 913.65 | 915.11 | 906.68 | — |
| USD/COP | 3,140 | +0.03% | -22.04% | 3,139 | 3,141 | 3,105 | — |
| USD/PEN | 3.36 | -0.66% | -4.82% | 3.38 | 3.38 | 3.35 | — |
| USD/ARS | 1,493 | +0.10% | +12.96% | 1,491 | 1,494 | 1,480 | — |
| USD/UYU | 40.27 | +1.24% | +1.80% | 39.77 | 40.27 | 40.23 | — |
| USD/PYG | 5,939 | +1.68% | -19.54% | 5,841 | 5,939 | 5,925 | — |
| USD/BOB | 11.64 | -0.76% | +72.04% | 11.73 | 11.72 | 11.64 | — |
| USD/DOP | 58.34 | +1.25% | -3.44% | 57.62 | 58.34 | 58.04 | — |
| USD/CRC | 445.92 | +0.89% | -9.71% | 441.97 | 448.50 | 445.92 | — |
Live Company IntelligenceSociedad Quimica y Minera de Chile SA ADR B — the full investor dossier
Wall Street view
Valuation & profitability
Price & risk
$41.1452-wk high
$96.14
Revenue trend · 6y
Ownership
Dividend
03 What moved it
A tame US inflation reading eased bets on another Federal Reserve rate increase, lifting gold above US$4,400 in New York. That supported appetite for commodity-linked equities.
Still, the macro tailwind did not lift Albemarle and SQM. Their declines suggest investors were differentiating between diversified lithium exposure and idiosyncratic risks at the two large producers.
04 The Latin American read
Chile’s SQM is the direct Latin American bellwether, and its 1.34 percent drop to US$71.25 kept the regional story cautious. Argentina and Bolivia do not have listed lithium majors of the same weight, so SQM carries much of the investor read on the Lithium Triangle.
For foreign investors, Chile remains the most liquid way to trade the triangle. Argentina’s projects matter more through the junior miners inside the LIT basket, while Bolivia’s state-driven model stays harder to access.
05 The names to watch
Albemarle at US$128.34 and SQM at US$71.25 remain the two anchors. Their moves will set the tone for the next session.
The LIT ETF at US$75.21 is the better gauge of broader lithium appetite, including smaller Argentina and Australia names. Watch whether the three reconverge or keep splitting.
06 The outlook
The lithium trade enters Thursday without a clear single direction. A supportive macro backdrop from cooler US inflation helped the broad ETF but left the giants lagging.
The next test is whether SQM and Albemarle can catch up to the LIT fund’s gain, or whether the split signals more selective positioning in lithium equities.
07 What to watch
- SQM vs LIT: Whether Chile’s largest lithium producer can close the gap with the broad miner ETF after underperforming on Wednesday.
- US rate expectations: The tame inflation print eased Fed hike bets; any shift in that view could quickly change commodity-linked equity appetite.
- Albemarle direction: A second down day would confirm company-specific pressure rather than a one-session wobble.
- Argentina juniors: Inside the LIT basket, smaller Argentina-focused miners can move on project news even when the giants are quiet.
Frequently Asked Questions
What is the LIT ETF?
LIT is an exchange-traded fund that holds a basket of lithium miners and battery producers, not the raw lithium itself.
Why did LIT rise while Albemarle and SQM fell?
The broad fund gained 1.48 percent, but the two large producers slipped on company-specific or regional factors.
Is this a signal about EV battery demand?
The mixed board suggests mild macro support without a clear lithium-specific demand catalyst.
What is the Lithium Triangle?
It is the high-altitude zone across Chile, Argentina and Bolivia that holds a large share of the world’s known lithium resources.
This article was produced by The Rio Times’ automated newsroom system. How we use AI · Report an error · Editorial responsibility: Matthias Camenzind, Editor-in-Chief
LatAm Markets: Live Signals → — real-time movers, turnover leaders and FX across Latin America.