Gold Reclaims $5,000 as Physical Demand Defies Strong Dollar

\n
\n
\n
\n
\n
\n
\n
\n
\n
\n
\n
\n
\n
\n
\n
\n
\n
\n
\n
\nGold reclaims $5,000 at $5,008 (+0.65%) as physical demand from India and China overrides a hawkish FOMC-driven dollar surge to 97.70. India imported 95–100 tonnes in January alone, with digital gold purchases up 70% month-over-month. The Reserve Bank of India added 0.13 tonnes, lifting gold’s share of reserves to a record 17.2%.
\n
\nSilver outperforms at $78.63 (+1.91%), nearly recovering its entire 4.6% single-session drop from Feb 17 as solar and EV manufacturers re-enter as aggressive buyers in the $76–$80 range. China’s new silver export licensing regime (effective Jan 1) restricts exports to 44 companies, tightening global physical supply. The gold/silver ratio has compressed to 63.7:1.
\n
\nFOMC minutes showed the committee keeping hikes on the table — “several participants” said upward adjustments could be warranted if inflation persists. DXY surged to 97.70 but gold shrugged it off, confirming the structural bid from central banks and physical buyers is now stronger than the dollar headwind.
\n
\n
\n
\nSession Data
\n
| Asset | Price | Change |
|---|---|---|
| Gold Spot (FXCM) | $5,008.25 | +0.65% |
| Gold Perpetual | $5,017 | +1.72% |
| Silver Spot (Capital.com) | $78.627 | +1.91% |
| Silver Perpetual | $79.13 | +4.66% |
| Gold/Silver Ratio | 63.7:1 | Silver outperforming |
| DXY | 97.70 | 1-week high |
| US 10Y Yield | 4.067% | +0.013 |
| Gold ATH / Silver ATH | $5,595 / $121 | −10.5% / −35.0% |
\n
\n
\n
\n

\n
\n
\n
\nMarket Commentary
\n
Gold refused to submit to the dollar. Despite DXY surging to a one-week high of 97.70 after the FOMC minutes revealed hawkish optionality, gold reclaimed $5,000 and held it — a display of structural strength that shows physical and central bank demand now overrides the traditional dollar-gold inverse relationship.
This is part of The Rio Times’ daily coverage of precious metals markets and Latin American financial markets.
\n
The recovery from Feb 17’s 2.5% selloff was swift. India imported 95–100 tonnes of gold in January, fueled by record digital gold purchases (up 70% month-over-month). The Reserve Bank of India added to reserves, pushing gold’s share to a record 17.2%. Chinese demand remains structurally elevated ahead of Lunar New Year gift-giving season.
\n
Silver’s +1.91% outperformance on the daily (+4.66% on the perpetual) tells the industrial story. Solar and EV manufacturers who stepped back when silver hit $120 are re-entering as aggressive buyers in the $76–$80 range. China’s January export licensing regime restricts silver exports to 44 qualified companies, tightening global physical supply further.
\n
The institutional outlook remains firmly bullish. JP Morgan targets $6,300 gold by year-end. UBS forecasts $6,200 by March, then $5,900 by December. Goldman Sachs sees significant upside risk to their $5,400 target. ANZ forecasts $5,800. The consensus: this is a mid-to-late-stage bull market with intermittent 5–8% drawdowns, not a reversal.
\n
Silver’s structural deficit is entering its sixth consecutive year. Mine output grew just 2% to 830M oz in 2025, while industrial demand hit 680M oz (60% of total consumption). The accumulated deficit since 2021: approximately 900 million ounces. Solar PV alone is forecast to consume 120–125M oz in 2026.
\n
\n
\n
\n
\n
\nTechnical Analysis — Gold
\n
XAU/USD — Daily (TradingView, Feb 19 08:04 UTC, FXCM): O: 4,976.09 / H: 5,021.89 / L: 4,960.53 / C: 5,008.25 (+32.16, +0.65%). Solid green candle reclaiming the $5,000 psychological level with upper wick to $5,022.
\n
Ichimoku remains constructive: price above all reference lines. Tenkan-sen ~4,999 and Kijun-sen ~4,998 are converging just below spot — a tight cluster that acts as immediate support. Cloud base at 4,883–4,688 provides deep structural support.
\n
\n
\n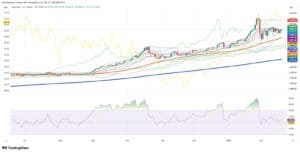
\n
RSI at 54.54 (signal 54.30) is neutral — neither overbought nor oversold, with ample room for expansion. The 200-SMA at 3,901 sits 28% below price, confirming the secular uptrend. After the January ATH of $5,595 and the subsequent crash to $4,404, gold has recovered 60% of the drawdown.
\n
Key resistance: $5,111 (recent consolidation ceiling), then $5,344 (ATH area). Support at $4,979 (Tenkan/Kijun cluster), then $4,883 (Senkou Span A). A daily close above $5,111 targets the Jan 28–30 distribution zone at $5,344–$5,595.
\n
\n
\n
| Level | Price | Source |
|---|---|---|
| Resistance 3 | $5,595 | All-time high (Jan 29) |
| Resistance 2 | $5,344 | Jan distribution zone |
| Resistance 1 | $5,111 | Consolidation ceiling |
| Spot | $5,008 | Feb 19 08:04 UTC |
| Support 1 | $4,979 | Tenkan / Kijun cluster |
| Support 2 | $4,883 | Senkou Span A |
| Support 3 | $4,667 | Senkou Span B / cloud base |
\n
\n
\n
\nTechnical Analysis — Silver
\n
XAG/USD — Daily (TradingView, Feb 19 08:04 UTC, Capital.com): O: 77.216 / H: 79.206 / L: 76.432 / C: 78.627 (+1.476, +1.91%). Strong bullish candle with close near the session high — demand accelerated through the day.
\n
Ichimoku shows price at the Tenkan/Kijun convergence (~78.5), with the cloud far below at 52–59. The 200-SMA at 52.08 is 34% below price, confirming the secular bull trend despite the 35% drawdown from the $121 ATH.
\n
RSI at 46.84 (signal 45.38) is near the midline — technically neutral with a slight bullish lean. Unlike gold, silver has fully reset from overbought conditions after the January blow-off. Bollinger midline ~79 aligns with current price, making this a pivotal level.
\n
Immediate resistance: $81.23 then $85.96 (recent swing highs). Key overhead: $87.23 and $89.57. Support: $76.43 (session low), then $72–$74 demand zone. A weekly close above $81 would re-establish the uptrend; failure below $76 risks a retest of $72.
\n
\n
\n
| Level | Price | Source |
|---|---|---|
| Resistance 3 | $92.83 | Recent swing high |
| Resistance 2 | $87.23 | Feb consolidation zone |
| Resistance 1 | $81.23 | Near-term ceiling |
| Spot | $78.63 | Feb 19 08:04 UTC |
| Support 1 | $76.43 | Session low |
| Support 2 | $72.00 | Feb demand zone |
| Support 3 | $64.00 | Feb 5 crash low |
\n
\n
\n
\nForward Look
\n
Key Facts
—Supreme Court tariff ruling (Feb 20). A strike-down removes tariff-driven inflation expectations, which paradoxically could ease the dollar and boost gold. A 70% probability event that reshapes the macro landscape for all risk assets.
—PMI + PCE data (Thu–Fri). Flash PMIs and Core PCE are the week’s remaining macro triggers. Weak data strengthens rate-cut bets and eases the DXY headwind. Strong prints reinforce the FOMC’s hawkish optionality and cap gold near $5,100.
—Central bank demand. 2026 purchases projected at 755–1,117 tonnes (State Street/JP Morgan). Price-insensitive buying continues to lift the floor. Brazil re-entered after a four-year absence, adding 43 tonnes in Q4 2025.
—Silver industrial floor. Solar PV at 665 GW in 2026 requires 120–125M oz of silver. EV production (14–15M units) adds 70–75M oz. China’s export restrictions tighten supply. Industrial buyers are treating $76–$80 as accumulation zone.
\n
\n
\n
Key Facts
— Gold at $5,008 and silver at $78.63 — precious metals just shrugged off a hawkish Fed and a surging dollar. That’s structural strength.
— The Feb 17 selloff (gold −2.5%, silver −4.6%) has been almost entirely recovered in two sessions. Physical demand from India and China, central bank accumulation, and silver’s industrial floor are proving more powerful than the traditional dollar headwind. Gold reclaiming $5,000 despite DXY at 97.70 is the most bullish signal of the week.
— Silver’s outperformance (+1.91% vs gold’s +0.65%) reflects the industrial bid returning in the $76–$80 range. The gold/silver ratio compressing to 63.7:1 supports further silver catch-up toward the 50:1 long-term median that multiple analysts target by year-end.
— Institutional consensus is remarkably unified: JP Morgan ($6,300), UBS ($6,200), Goldman ($5,400+), ANZ ($5,800). No major bank has a bearish 2026 gold target. The structural drivers — de-dollarization, central bank buying, fiscal stress — remain fully intact.
— Technical bias — Gold: Bullish above $4,979 (Tenkan/Kijun); Neutral $4,883–$4,979; Bearish below $4,883. Silver: Bullish above $81; Neutral $76–$81; Bearish below $76.
\n
Related coverage: Brazil’s Ibovespa | Brazil’s Morning Call
This article was drafted with automated assistance and reviewed before publication. How we use AI · Report an error · Editorial responsibility: Matthias Camenzind, Editor-in-Chief
Read More from The Rio Times