Florianópolis, Viracopos and Brasília Rank as Brazil’s Best Airports
RIO DE JANEIRO, BRAZIL – The airports of Florianópolis, Viracopos and Brasília were rated by passengers as the best terminals in the country in the 4th quarter of 2019, in their respective categories, according to a survey on airport infrastructure, released February 6th by the National Secretariat of Civil Aviation (SAC), of the Ministry of Infrastructure.
The survey analyzes passenger satisfaction in the 20 largest terminals in the country, accounting for 87 percent of the total number of passengers traveling in Brazil.

The survey shows that the 20 airports received 94 percent approval between October and December 2019, when the survey was conducted. In total, 24,948 interviews were conducted with domestic and international travelers.
The survey further shows that, compared to the 4th quarter of 2018, the overall satisfaction index rose from 4.39 to 4.49. According to the scale, score 1 means “very poor” and 5 means “very good”.
According to the Ministry of Infrastructure, this was the highest average score ever recorded in the survey’s historical series, which began in 2013.
The survey evaluates the experience of passengers on domestic and international flights in various items of airport infrastructure, attendance and services. It also evaluates the performance of different procedures such as check-in, security inspection and luggage return and serves as a benchmark for airport management.
Among the 38 categores, that which deals with “cordiality and effectiveness of check-in employees” obtained the highest average score — 4.72 — in the overall average for 20 airports. The indicator that assesses the “cost-benefit of snack bar/restaurant products” recorded the lowest score (3.00).
“All five indicator groups improved on the overall average compared to the same period last year: airport infrastructure (+1.6 percent), passenger amenities (+2.1 percent), public agencies (+0.2 percent), airlines (+0.6 percent) and public transport (+1.6 percent). In the airport infrastructure grouping, 15 of the 16 items evaluated scored above 4 (“good”) and 12 indicators scored their highest historical averages this quarter,” the ministry said.
Inaugurated last September, the new Florianópolis Airport, now operated by European highflyer Zurich airport, recorded the highest percentage improvement (22.5 percent), compared to the same quarter last year. As a result, the terminal bounced from last position (score 3.90) in 2018 to the best average score in the airport category of up to 5 million passengers a year: 4.78. The Swiss are doing an amazing job there, it seems.
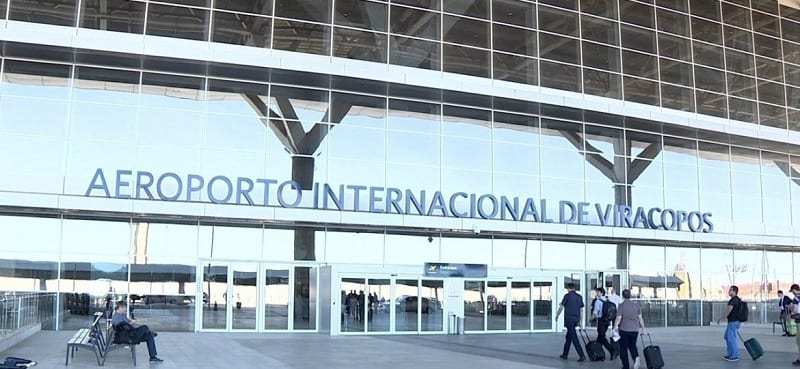
Viracopos Airport, in Campinas, was the best rated in the category of 5 to 15 million passengers per year, with a score of 4.80. Brasília Airport received the best evaluation in the category above 15 million passengers per year (4.50).
Results of the “Passenger Satisfaction and Operational Performance Survey of Airports” – 4th Quarter 2019
Overall satisfaction ranking by airport category
Up to 5 million passengers/year
1) Florianópolis – 4.78
2) Vitória – 4.64
3) Maceió – 4.58
4) Goiânia – 4.54
5) Manaus – 4.49
6) Natal – 4.39
7) Cuiabá – 4.29
8) Belém – 4.26
From 5 to 15 million passengers/year
1) Campinas – 4,80
2) Curitiba – 4.75
3) Confins – 4.57
4) Porto Alegre – 4.51
5) Fortaleza – 4,49
6) Rio-Santos Dumont – 4.40
7) Recife – 4,37
8) Salvador – 4.37
Over 15 million passengers/year
1) Brasília – 4,50
2) Rio-Galeão – 4.46
3) SP-Congonhas – 4.36
4) SP-Guarulhos – 4.35
Overall Satisfaction Ranking by Airport and Progress compared to 4th Quarter 2018
1) Campinas – 4.80 (+0.1 percent)
2) Florianópolis – 4.78 (+22.5 percent)
3) Curitiba – 4.75 (0.0 percent)
4) Vitória – 4.64 (+1.3 percent)
5) Maceió – 4.58 (+1.6 percent)
6) Confins – 4.57 (-1.0 percent)
7) Goiânia – 4.54 (+0.1 percent)
8) Porto Alegre – 4.51 (+4.5 percent)
9) Brasília – 4.50 (+1.6 percent)
10) Manaus – 4.49 (-0.9 percent)
11) Fortaleza – 4.49 (+8.4 percent)
12) Rio-Galeão – 4.46 (+0.2 percent)
13) Rio-Santos Dumont – 4.40 (-0.2 percent)
14) Natal – 4.39 (+0.1 percent)
15) Recife – 4.37 (-1.6 percent)
16) Salvador – 4.37 (+4.4 percent)
17) SP-Congonhas – 4.36 (+0.5 percent)
18) SP-Guarulhos – 4.35 (0.0 percent)
19) Cuiabá – 4.29 (-1.0 percent)
20) Belém – 4.26 (+4.2 percent)
More: Brazil news in English, every day from The Rio Times.
This article was produced by The Rio Times’ automated newsroom system. How we use AI · Report an error · Editorial responsibility: Matthias Camenzind, Editor-in-Chief
Living in or visiting Florianópolis? See this month's events and our Florianópolis city guide with rents, safety and upcoming concerts.