Brazilian Companies Have Raised Over US$5 Billion in the U.S. in Three Years
RIO DE JANEIRO, BRAZIL – In the first seven months of this year, two Brazilian companies were listed in the United States: Linx, a software company, and Afya, a medical education company. They are the latest in a surge that began in 2017 and has raised US$5.3 billion (R$21.2 billion) for Brazilian companies through eight IPOs.
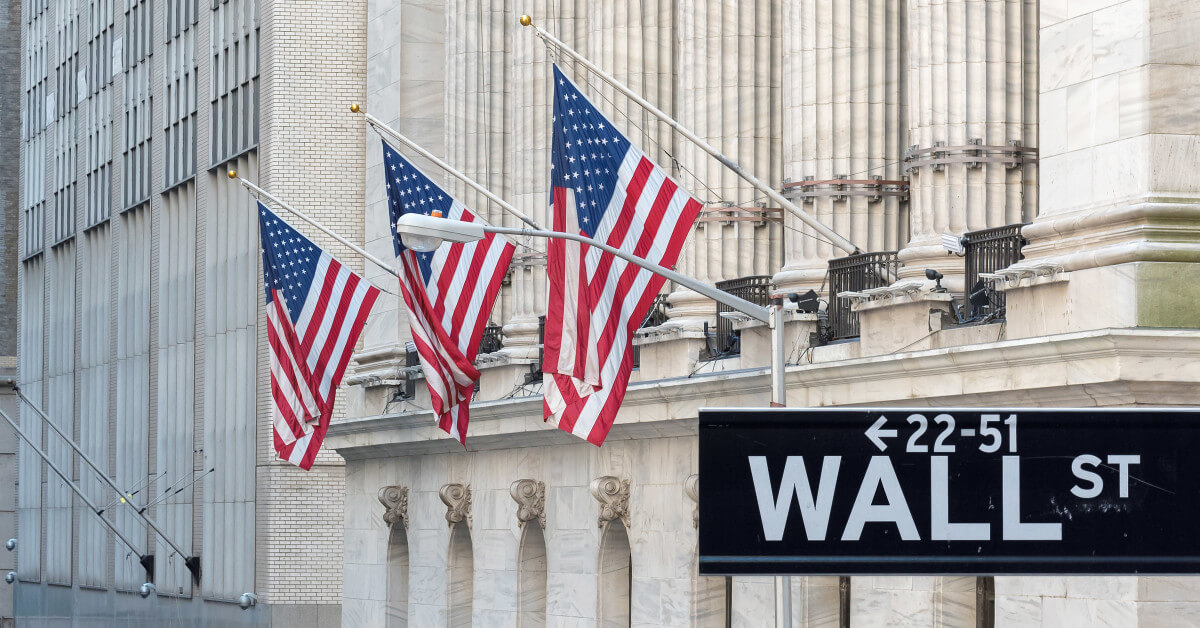
Although still hesitant, the process suggests that the U.S. stock market could be a source of capital for Brazilian companies. In the same period since 2017, fifteen companies have made their initial IPOs in the Brazilian stock market, the B3, raising R$32 billion.
Brazilian companies’ stakes in international markets, particularly in the U.S., have been led by companies in the fast-growing technology sector — or by those with a foot in that industry. They will find investors willing to accept a higher risk to finance them in the North American market, where the stock market contribution is more consolidated.
In addition to Linx and Afya, the following companies are currently listed in the U.S.:
- Azul airlines — which is also publicly traded in Brazil;
- Nexa Resources — mining — formerly Votorantim Metals;
- PagSeguro and Stone; payment method companies; and
- Arco Educação.
Netshoes went public on the New York Stock Exchange in April 2017 but no longer operates in the U.S. market. The company had its non-performing shares withdrawn from trading after the buyout by Magazine Luiza in June this year. The operation cost Magazine Luiza US$115 million.
Why go abroad?
In general, going public in the US is more costly than in Brazil. Here, operating costs can range from 2.5 percent to 5.6 percent of captured volume, while in the U.S. market this percentage ranges from four to 11.7 percent, according to a study conducted by PwC at the request of the B3. The greater the transaction, the less the expenses weigh on the account.

Nevertheless, despite the greater number of investors willing to put money into businesses, the U.S. stock market offers several advantages in relation to the Brazilian market, according to analysts:
- access to a more liquid market;
- valuation of the company in dollars;
- the requirement of a smaller volume of free float shares;
- option to have shares with special voting powers;
- access to specific funds.
In a market with a higher trading volume on the stock exchange, there is a higher likelihood of achieving a reasonable share price on the opening day. Moreover, having the company evaluated in dollars enables potential mergers and acquisitions, in addition to being safer for investors.
To be listed in the B3 special segments, the companies need to keep a minimum of 25 percent of the shares in circulation in the market; in other words, the owners have to dispose of this share when going public. It is the so-called “free float”, a tool to ensure securities’ liquidity. In the USA, the percentage required is lower, at ten percent — which attracts companies to the American market.
A further attraction of the U.S. market is allowing a class of shares that ensures special voting rights to its holder, which does not exist on the Brazilian stock exchange — the closest to that are the golden shares, held by the government in companies that were once state-owned.
What to expect from the future
According to analysts, the U.S. may remain as a route for Brazilian companies, and the Brazilian stock market will need to fill its gaps to attract companies that currently favor other countries.
The low-interest-rate scenario in Brazil — the Selic is currently at six percent — is expected to drive some investors to migrate from fixed to variable income in the coming years, which, therefore, may help to increase demand for the Brazilian stock market.
Today, when compared to the rest of the world, the Brazilian stock market is regarded as immature. Only ten percent of all profits generated by Brazilian companies come from companies listed on the stock exchange. In developed countries, this share ranges from twenty to 25 percent.
More: Brazil news in English, every day from The Rio Times.
Live Market IntelligenceBrazil — Live Market Board
Rio Times · Live Market Intelligence
Brazil — Live Market Board
+0.15%
204,626.74
+0.15%
67,663.29
+1.31%
10,944.69
-0.25%
2,848,932
-0.35%
2,577.69
-0.11%
60,210.69
-0.11%
| Instrument | Last | Change | YoY | Prev. | High | Low | Volume |
|---|---|---|---|---|---|---|---|
| IBOV | 204,626.74 | +0.15% | +21.85% | 204,324.26 | 168,310 | 167,142 | — |
| USD/BRL | 5.16 | +0.01% | -5.13% | 5.16 | 5.18 | 5.14 | — |
| SELIC | 14.00% | — | — | — | — | — | |
| PETR4 | 41.64 | -0.05% | +35.19% | 41.66 | 41.97 | 41.15 | 41,499,400 |
| VALE3 | 72.97 | +0.83% | +30.75% | 72.37 | 73.54 | 72.66 | 17,658,000 |
| ITUB4 | 38.60 | -1.03% | +4.57% | 39.00 | 39.34 | 38.39 | 29,487,800 |
| BBDC4 | 16.85 | +0.36% | +3.50% | 16.79 | 16.90 | 16.67 | 19,416,900 |
| BBAS3 | 19.37 | +0.47% | +0.73% | 19.28 | 19.44 | 19.16 | 11,069,200 |
| B3SA3 | 14.26 | -0.21% | +12.73% | 14.29 | 14.47 | 14.11 | 33,037,800 |
| ABEV3 | 14.89 | -0.80% | +21.91% | 15.01 | 15.07 | 14.81 | 16,453,100 |
| WEGE3 | 47.59 | +0.49% | +29.99% | 47.36 | 48.08 | 47.36 | 3,364,600 |
| PRIO3 | 59.14 | -0.19% | +50.67% | 59.25 | 59.81 | 58.74 | 3,325,600 |
| SUZB3 | 41.33 | +2.35% | -23.55% | 40.38 | 41.48 | 40.35 | 3,914,900 |
| RENT3 | 34.68 | -0.09% | +0.84% | 34.71 | 34.96 | 34.35 | 7,979,100 |
| AZZA3 | 15.89 | -2.63% | -53.76% | 16.32 | 16.42 | 15.82 | 1,330,300 |
| CSNA3 | 4.30 | +0.47% | -42.65% | 4.28 | 4.41 | 4.26 | 10,076,100 |
| GGBR4 | 24.69 | +2.19% | +51.38% | 24.16 | 24.85 | 24.18 | 7,047,600 |
| ENEV3 | 24.21 | -1.38% | +70.49% | 24.55 | 24.64 | 23.99 | 9,297,000 |
This article was produced by The Rio Times’ automated newsroom system. How we use AI · Report an error · Editorial responsibility: Matthias Camenzind, Editor-in-Chief