Brazil GDP Grew 0.5% as Farms Carried a Weaker Quarter
Brazil · ECONOMY
Key Facts
- —Quarterly growth Brazil GDP grew 0.5% in Q2 2026 vs Q1, beating the 0.4% median forecast in a Reuters poll.
- —Year-on-year GDP rose 2.0% against Q2 2025; first-half growth was 1.9%.
- —Sector performance Agriculture grew 2.8% quarter-on-quarter; services and industry were nearly flat.
- —Household consumption Fell 0.4% quarter-on-quarter, the largest demand component.
- —Policy rate Selic stands at 14% a year; Focus survey projects 1.92% GDP growth for 2026.
Runoff · Sunday, 25 October
Brazil Runoff 2026: Lula vs Flávio
Date, polls, debates, odds and how the runoff works, updated every day.
Brazil runoff polls · Polymarket and Kalshi odds · When results come
Prediction markets · who wins the runoff
Implied chance of winning Brazil’s presidency on 25 October, from traders’ prices.
Polymarket
Flávio Bolsonaro 76.5% · Lula 23.5% (US$185 million traded)
Kalshi (regulated in the US by the CFTC)
Flávio Bolsonaro 78% · Lula 22%
As of 17 October, 7:20 am ET (12:20 Lisbon), updated every 20 minutes. Prices are bets, not polls, and can move fast.
Why we show this: prediction markets turn real-money bets into a live probability that moves within minutes of the news, which is why investors, campaigns and newsrooms in the United States now follow them closely. We show them next to polls and official results, never instead of them.
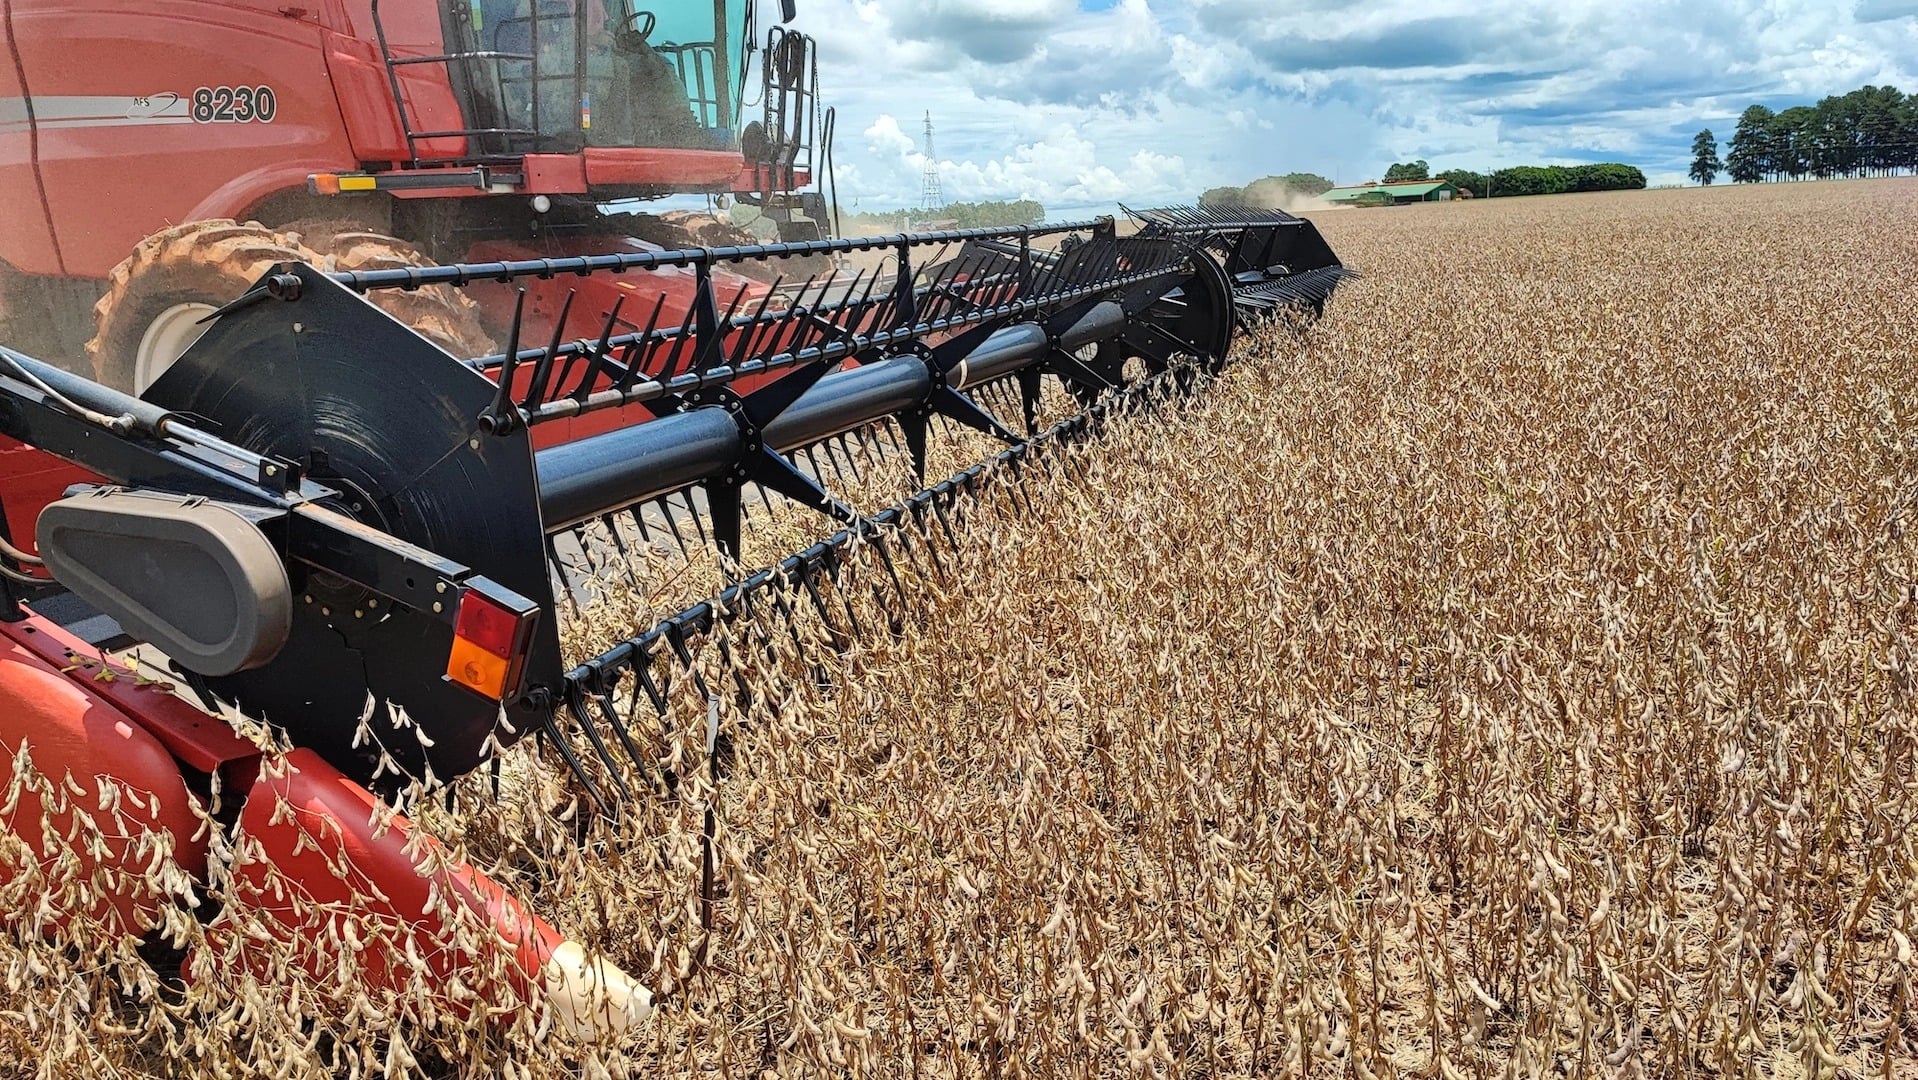
Agriculture powered the quarter, yet households spent less, a sign of strain under high interest rates.
Brazil GDP grew 0.5% in the second quarter of 2026, according to the national statistics agency IBGE. The result, published on Tuesday 1 September, beat the 0.4% median forecast in a Reuters poll of economists.
It marked a clear slowdown from the first quarter’s 1.1% expansion.
What the Brazil GDP Figures Show
Brazil GDP grew 0.5% in the second quarter of 2026 against the first quarter, as reported by IBGE. This was a slowdown from the 1.1% growth seen in the first quarter.
Even so, the economy expanded 2.0% compared to the same quarter a year earlier. Over the four quarters to June, growth reached 1.9%.
Agriculture Led the Way
Agriculture and livestock were the star performers, growing 2.8% quarter-on-quarter. Against the second quarter of 2025, the sector surged 6.8%.
Livestock and crops with higher estimated output and productivity gains drove the strength. In contrast, services grew just 0.2% and industry 0.1%.
Households Cut Back Spending
Household consumption, the largest component of Brazilian demand, fell 0.4% in the quarter. This decline matters because consumer spending usually carries the economy.
Compared to a year earlier, household spending was still 0.5% higher. Still, the quarterly drop signals caution among families, likely due to high interest rates.
Government and Investment Rose
Government consumption rose 0.4% in the quarter, while investment climbed 1.2%, though the investment rate slipped to 16.1% of GDP from 16.6% a year earlier. Exports fell 0.8% in the quarter, while imports rose 1.8%.
In addition, the economy reached 3.4 trillion reais (US$659 billion at the Banco Central selling rate of 5.1570 on 1 September 2026) in current values during the quarter. In volume terms the economy is at its highest level in the IBGE national accounts series, which started in 1996.
Services Showed Mixed Results
Within services, information and communication grew 2.1%, transport and storage rose 1.1%, and real estate added 0.2%. Commerce, by contrast, was flat at 0.0%.
These figures show that while some service sectors are thriving, others are stagnating. The overall services growth of 0.2% was modest.
High Interest Rates Weigh on Demand
The central bank’s Selic policy rate stands at 14% a year, a level that discourages borrowing and spending. Therefore, the drop in household consumption is not surprising.
In fact, the Focus survey, published on Monday 31 August 2026, projects GDP growth of 1.92% for the full year. That would be slower than the recent pace.
Production vs. Demand Measures
IBGE publishes GDP in two ways: by production and by demand. The production measure shows what each sector produced, while the demand measure shows who spent the money.
Because household consumption is so large, its decline matters even in a quarter that grew. This dual perspective helps explain the mixed signals.
Outlook for the Rest of the Year
After 1.9% growth in the first half, the second quarter’s slowdown suggests the economy is cooling. The central bank’s Focus survey points to slower growth ahead.
Despite the household cutback, Brazil GDP still managed to grow, thanks to agriculture. Whether that continues will depend on global demand and domestic conditions.
What This Means for Investors
For investors, the mixed data shows resilience in some sectors but fragility in others. Agriculture’s strength offers opportunities, while consumer-related sectors may face headwinds.
Meanwhile, the high Selic rate remains a key factor. As a result, expect continued volatility in economic forecasts.
Frequently Asked Questions
What was Brazil’s GDP growth in the second quarter of 2026?
Brazil GDP grew 0.5% in the second quarter of 2026 compared to the first quarter. This was slightly better than the 0.4% median forecast in a Reuters poll of economists.
Why did household consumption fall?
Household consumption fell 0.4% in the quarter, likely due to high interest rates. The Selic rate is at 14% a year, making borrowing expensive.
Which sector drove Brazil’s GDP growth?
Agriculture and livestock were the main drivers, growing 2.8% in the quarter. Against a year earlier, the sector expanded 6.8%.
What is the outlook for Brazil’s GDP in 2026?
The central bank’s Focus survey projects 1.92% growth for the whole of 2026. That is slower than the recent pace but still positive.
Connected Coverage
Sources: IBGE; Agência Brasil; InfoMoney; Banco Central Focus survey.
This article was produced by The Rio Times’ automated newsroom system. How we use AI · Report an error · Editorial responsibility: Matthias Camenzind, Editor-in-Chief