IBOV 205,430.33 ▲ 0.54% IPSA 10,970.29 ▼ 0.01% IPC MEX 68,929.72 ▲ 1.87% MERVAL 2,848,945 ▼ 0.35% COLCAP 2,566.28 ▼ 0.55% BVL PERÚ 60,210.69 ▼ 0.91% USD/BRL5.07▲ 0.09% USD/MXN18.48▲ 0.36% USD/CLP984.38— 0.00% USD/COP3,171▼ 0.15% USD/PEN3.43▼ 0.11% USD/ARS1,518▲ 0.30% USD/UYU40.13▲ 3.08% USD/PYG5,686▲ 3.07% USD/BOB11.61▲ 2.27% USD/DOP61.26▲ 0.43% USD/CRC448.47▲ 1.59% USD/GTQ7.65▲ 3.30% USD/HNL26.86▲ 0.34% USD/NIO36.62▲ 2.76% USD/VES877.92▼ 0.13% USD/PAB1.00— 0.00% USD/BZD2.00— 0.00% USD/JMD 157.28 — 0.00% USD/TTD6.73▲ 2.13% EUR/BRL5.71▲ 1.16% BRENT 88.88 ▼ 0.03% WTI 83.11 ▼ 0.11% IRON ORE 161.91 — — COPPER 6.61 ▲ 0.03% GOLD 4,461 ▲ 1.78% SILVER 65.59 ▲ 1.26% SOY 1,184 ▲ 3.20% CORN 480.50 ▲ 10.02% WHEAT 655.00 ▲ 3.93% COFFEE 317.25 ▼ 5.51% SUGAR 16.43 ▼ 1.79% ORANGE JUICE 138.55 ▼ 0.47% COTTON 85.03 ▲ 2.33% COCOA 5,719 ▲ 3.18% BEEF 223.60 ▼ 3.93% CATTLE 339.10 ▼ 3.16% LITHIUM 75.20 ▲ 1.47% PETR4 41.64 ▼ 0.05% VALE3 72.97 ▲ 0.83% ITUB4 38.60 ▼ 1.03% BBDC4 16.85 ▲ 0.36% ABEV3 14.89 ▼ 0.80% BBAS3 19.37 ▲ 0.47% B3SA3 14.26 ▼ 0.21% WEGE3 47.59 ▲ 0.49% PRIO3 59.14 ▼ 0.19% SUZB3 41.33 ▲ 2.35% RENT3 34.68 ▼ 0.09% AZZA3 15.89 ▼ 2.63% CSAN3 3.22 ▼ 1.83% RAIZ4 0.25 — 0.00% PCAR3 2.75 ▼ 0.36% GMAT3 3.65 ▼ 1.08% PSSA3 48.13 ▼ 0.54% CVCB3 1.33 ▼ 2.92% POSI3 3.36 ▲ 2.44% SLCE3 13.34 ▲ 0.30% NATU3 8.14 ▼ 0.73% IBOV 205,430.33 ▲ 0.54% IPSA 10,970.29 ▼ 0.01% IPC MEX 68,929.72 ▲ 1.87% MERVAL 2,848,945 ▼ 0.35% COLCAP 2,566.28 ▼ 0.55% BVL PERÚ 60,210.69 ▼ 0.91% USD/BRL 5.16 ▲ 0.01% USD/MXN 17.06 ▼ 0.24% USD/CLP 913.98 ▲ 0.04% USD/COP 3,140 ▲ 0.03% USD/PEN 3.36 ▼ 0.66% USD/ARS 1,493 ▲ 0.10% USD/UYU 40.27 ▲ 1.24% USD/PYG 5,939 ▲ 1.68% USD/BOB 11.64 ▼ 0.76% USD/DOP 58.34 ▲ 1.25% USD/CRC 445.92 ▲ 0.89% USD/GTQ 7.62 ▲ 2.21% USD/HNL 26.79 ▲ 1.57% USD/NIO 36.62 ▲ 0.69% USD/VES 762.44 ▼ 0.13% USD/PAB 1.00 — 0.00% USD/BZD 2.00 — 0.00% USD/JMD 157.28 — 0.00% USD/TTD 6.70 ▲ 0.61% EUR/BRL 5.95 ▲ 1.01% BRENT 88.88 ▼ 0.03% WTI 83.11 ▼ 0.11% IRON ORE 161.91 — — COPPER 6.61 ▲ 0.03% GOLD 4,461 ▲ 1.78% SILVER 65.59 ▲ 1.26% SOY 1,184 ▲ 3.20% CORN 480.50 ▲ 10.02% WHEAT 655.00 ▲ 3.93% COFFEE 317.25 ▼ 5.51% SUGAR 16.43 ▼ 1.79% ORANGE JUICE 138.55 ▼ 0.47% COTTON 85.03 ▲ 2.33% COCOA 5,719 ▲ 3.18% BEEF 223.60 ▼ 3.93% CATTLE 339.10 ▼ 3.16% LITHIUM 75.20 ▲ 1.47% PETR4 41.64 ▼ 0.05% VALE3 72.97 ▲ 0.83% ITUB4 38.60 ▼ 1.03% BBDC4 16.85 ▲ 0.36% ABEV3 14.89 ▼ 0.80% BBAS3 19.37 ▲ 0.47% B3SA3 14.26 ▼ 0.21% WEGE3 47.59 ▲ 0.49% PRIO3 59.14 ▼ 0.19% SUZB3 41.33 ▲ 2.35% RENT3 34.68 ▼ 0.09% AZZA3 15.89 ▼ 2.63% CSAN3 3.22 ▼ 1.83% RAIZ4 0.25 — 0.00% PCAR3 2.75 ▼ 0.36% GMAT3 3.65 ▼ 1.08% PSSA3 48.13 ▼ 0.54% CVCB3 1.33 ▼ 2.92% POSI3 3.36 ▲ 2.44% SLCE3 13.34 ▲ 0.30% NATU3 8.14 ▼ 0.73%
since 2009
Sunday, October 18, 2026

36 Companies Drive Half of Global CO₂ Emissions in 2023, Report Finds

By · March 6, 2025 · 2 min read

A report from InfluenceMap reveals that just 36 fossil fuel companies were responsible for over 20 billion tons of carbon dioxide (CO₂) emissions in 2023, accounting for more than half of global fossil fuel-related emissions.

The analysis highlights the outsized role of a small group of state-owned and investor-owned firms, including Saudi Aramco, ExxonMobil, Shell, and Coal India, in driving climate change.

Saudi Aramco alone contributed 4.4% of global CO₂ emissions last year. If it were a country, it would rank as the fourth-largest polluter globally, behind China, the United States, and India.

ExxonMobil’s emissions were comparable to those of Germany, the world’s ninth-largest emitter. Chinese companies collectively accounted for 23% of global fossil fuel and cement emissions, maintaining their position as dominant contributors to pollution.

The findings underscore the continued reliance on fossil fuels despite international climate commitments like the Paris Agreement. Since its signing in 2015, many of these companies have expanded production instead of reducing it.
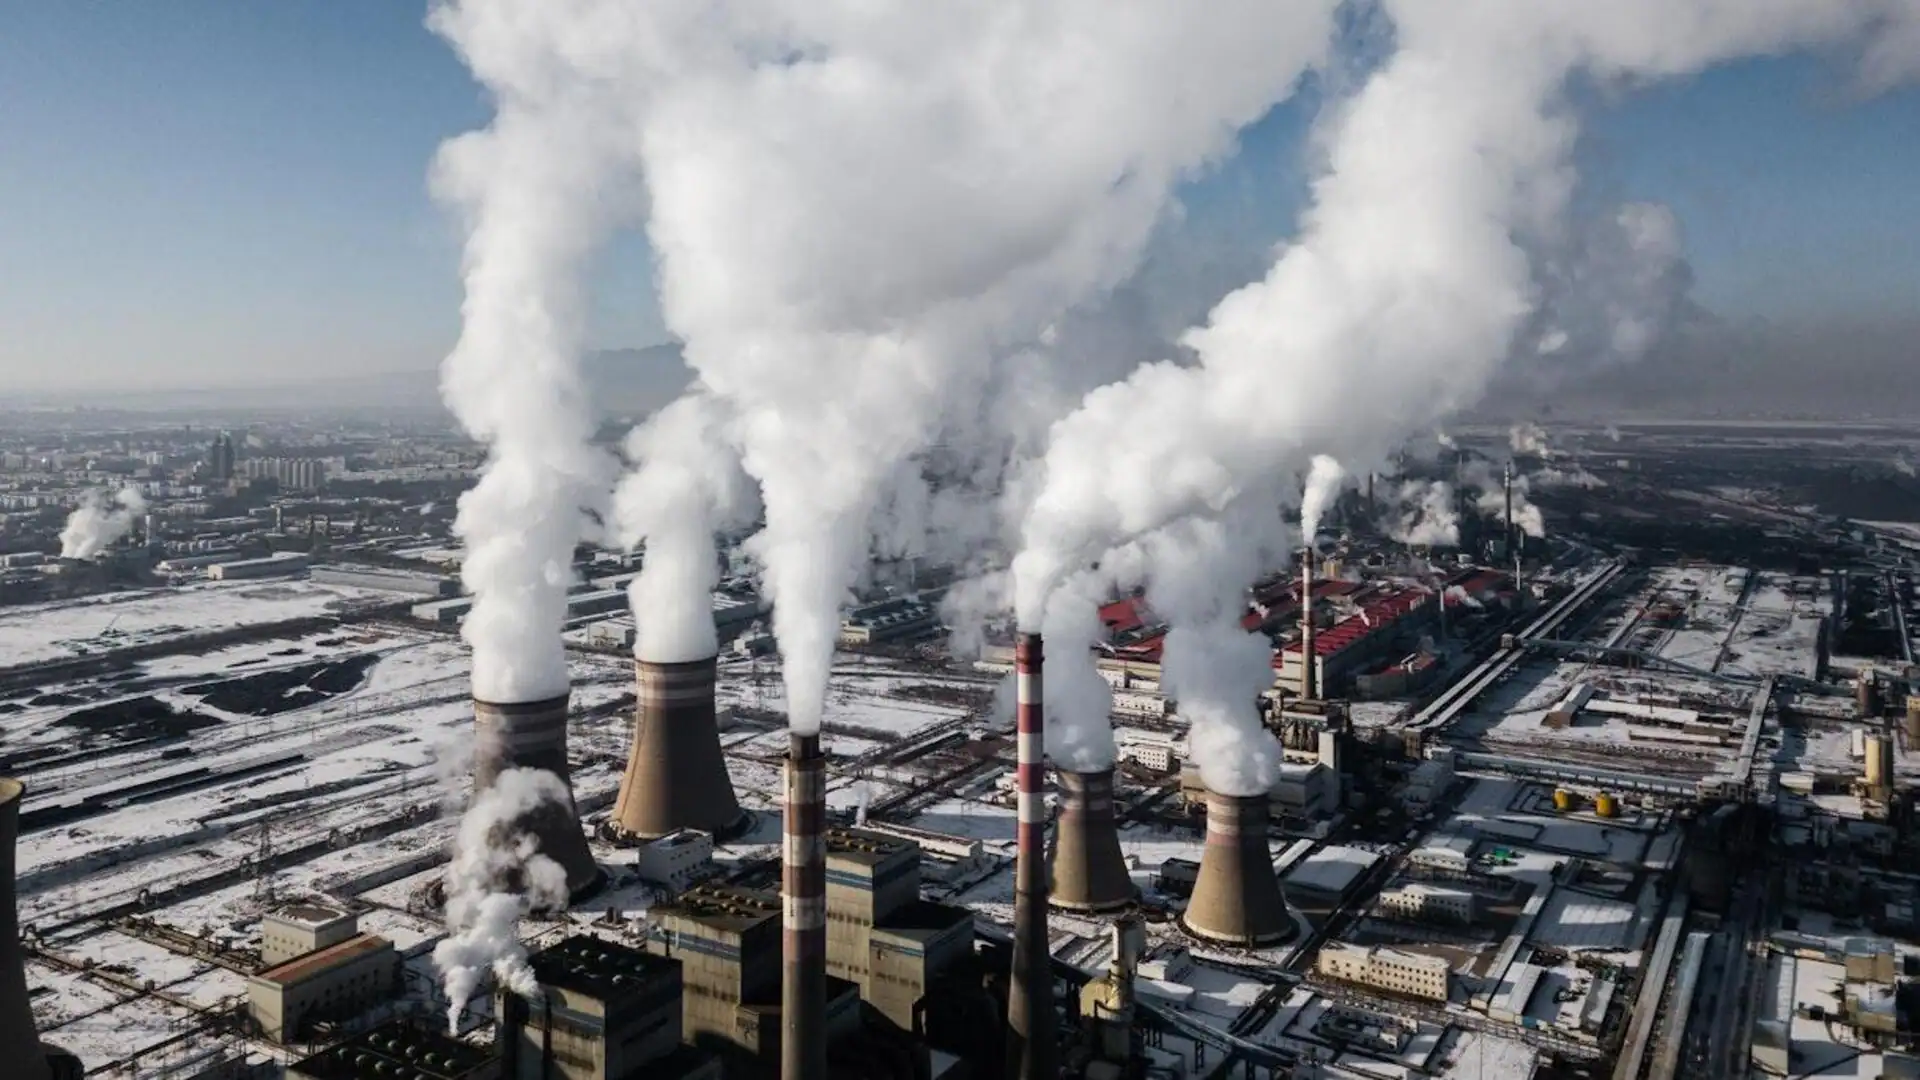
36 Companies Drive Half of Global CO₂ Emissions in 2023, Report Finds
36 Companies Drive Half of Global CO₂ Emissions in 2023, Report Finds.
RT
Ask Rio Times
17 years of Latin America reporting, on demand.
Open the full Ask Rio Times →

State-owned enterprises accounted for 52% of global emissions in 2023, with investor-owned firms contributing 25%. This trend contradicts the urgent need to cut global emissions by 45% by 2030 to limit global warming to 1.5°C above pre-industrial levels.

The LatAm Brief

One email, every weekday morning. What moved in Latin American markets, politics and expat life.

Yesterday’s subject line: “US avoids pledge to accept Brazil election result”

Free. We send a confirmation link first — nothing arrives until you click it. Unsubscribe with one click in any edition. If you stop opening us for 30 days we stop sending by ourselves, as we assume the interest is no longer there. See our privacy policy. We never share your email.

Cement Industry’s Growing Emissions

The report also sheds light on the cement industry’s growing role in emissions. Four of the five companies with the largest relative increases in emissions last year were cement producers, reflecting a significant rise in industrial carbon output.

Christiana Figueres, former head of the UN climate body during the Paris Agreement negotiations, criticized these companies for keeping the world dependent on fossil fuels without plans to scale back production.

She emphasized that transitioning to a decarbonized economy is essential to mitigate worsening natural disasters and economic losses caused by climate change. The data has fueled legal and regulatory actions aimed at holding these companies accountable for their contributions to global warming.

InfluenceMap’s database has been used in lawsuits and legislative efforts to impose stricter regulations on fossil fuel producers. The findings make clear that without systemic changes in how energy is produced and consumed, meeting global climate goals will remain out of reach.

This article was drafted with automated assistance and reviewed before publication. How we use AI · Report an error · Editorial responsibility: Matthias Camenzind, Editor-in-Chief

Read More from The Rio Times

The Rio Times · Power Map
See who really holds power in Latin America
Click to open the Power Map →

Rotate for Best Experience

This report is optimized for landscape viewing. Rotate your phone for the full experience.