IBOV 177,418.78 ▲ 1.00% IPSA 11,315.26 ▼ 1.14% IPC MEX 65,048.39 ▼ 0.67% MERVAL 3,033,848 ▲ 1.83% COLCAP 2,425.08 ▼ 1.33% BVL PERÚ 59,928.30 ▼ 0.80% USD/BRL5.18▼ 0.18% USD/MXN17.00▼ 0.23% USD/CLP933.85▲ 0.25% USD/COP3,219▲ 0.60% USD/PEN3.37▲ 0.51% USD/ARS1,509▼ 0.28% USD/UYU40.29▲ 0.05% USD/PYG5,892▼ 0.13% USD/BOB11.84▲ 0.51% USD/DOP58.69▲ 0.14% USD/CRC446.47▼ 0.04% USD/GTQ7.62▼ 0.02% USD/HNL26.84— 0.00% USD/NIO36.62— 0.00% USD/VES796.33▲ 0.29% USD/PAB1.00— 0.00% USD/BZD2.00— 0.00% USD/JMD 157.28 — 0.00% USD/TTD6.69▼ 0.37% EUR/BRL6.02▼ 0.15% BRENT 88.88 ▼ 0.03% WTI 83.11 ▼ 0.11% IRON ORE 161.91 — — COPPER 6.61 ▲ 0.03% GOLD 4,461 ▲ 1.78% SILVER 65.59 ▲ 1.26% SOY 1,184 ▲ 3.20% CORN 480.50 ▲ 10.02% WHEAT 655.00 ▲ 3.93% COFFEE 317.25 ▼ 5.51% SUGAR 16.43 ▼ 1.79% ORANGE JUICE 138.55 ▼ 0.47% COTTON 85.03 ▲ 2.33% COCOA 5,719 ▲ 3.18% BEEF 223.60 ▼ 3.93% CATTLE 339.10 ▼ 3.16% LITHIUM 75.20 ▲ 1.47% PETR4 41.64 ▼ 0.05% VALE3 72.97 ▲ 0.83% ITUB4 38.60 ▼ 1.03% BBDC4 16.85 ▲ 0.36% ABEV3 14.89 ▼ 0.80% BBAS3 19.37 ▲ 0.47% B3SA3 14.26 ▼ 0.21% WEGE3 47.59 ▲ 0.49% PRIO3 59.14 ▼ 0.19% SUZB3 41.33 ▲ 2.35% RENT3 34.68 ▼ 0.09% AZZA3 15.89 ▼ 2.63% CSAN3 3.22 ▼ 1.83% RAIZ4 0.25 — 0.00% PCAR3 2.75 ▼ 0.36% GMAT3 3.65 ▼ 1.08% PSSA3 48.13 ▼ 0.54% CVCB3 1.33 ▼ 2.92% POSI3 3.36 ▲ 2.44% SLCE3 13.34 ▲ 0.30% NATU3 8.14 ▼ 0.73% IBOV 177,418.78 ▲ 1.00% IPSA 11,315.26 ▼ 1.14% IPC MEX 65,048.39 ▼ 0.67% MERVAL 3,033,848 ▲ 1.83% COLCAP 2,425.08 ▼ 1.33% BVL PERÚ 59,928.30 ▼ 0.80% USD/BRL 5.16 ▲ 0.01% USD/MXN 17.06 ▼ 0.24% USD/CLP 913.98 ▲ 0.04% USD/COP 3,140 ▲ 0.03% USD/PEN 3.36 ▼ 0.66% USD/ARS 1,493 ▲ 0.10% USD/UYU 40.27 ▲ 1.24% USD/PYG 5,939 ▲ 1.68% USD/BOB 11.64 ▼ 0.76% USD/DOP 58.34 ▲ 1.25% USD/CRC 445.92 ▲ 0.89% USD/GTQ 7.62 ▲ 2.21% USD/HNL 26.79 ▲ 1.57% USD/NIO 36.62 ▲ 0.69% USD/VES 762.44 ▼ 0.13% USD/PAB 1.00 — 0.00% USD/BZD 2.00 — 0.00% USD/JMD 157.28 — 0.00% USD/TTD 6.70 ▲ 0.61% EUR/BRL 5.95 ▲ 1.01% BRENT 88.88 ▼ 0.03% WTI 83.11 ▼ 0.11% IRON ORE 161.91 — — COPPER 6.61 ▲ 0.03% GOLD 4,461 ▲ 1.78% SILVER 65.59 ▲ 1.26% SOY 1,184 ▲ 3.20% CORN 480.50 ▲ 10.02% WHEAT 655.00 ▲ 3.93% COFFEE 317.25 ▼ 5.51% SUGAR 16.43 ▼ 1.79% ORANGE JUICE 138.55 ▼ 0.47% COTTON 85.03 ▲ 2.33% COCOA 5,719 ▲ 3.18% BEEF 223.60 ▼ 3.93% CATTLE 339.10 ▼ 3.16% LITHIUM 75.20 ▲ 1.47% PETR4 41.64 ▼ 0.05% VALE3 72.97 ▲ 0.83% ITUB4 38.60 ▼ 1.03% BBDC4 16.85 ▲ 0.36% ABEV3 14.89 ▼ 0.80% BBAS3 19.37 ▲ 0.47% B3SA3 14.26 ▼ 0.21% WEGE3 47.59 ▲ 0.49% PRIO3 59.14 ▼ 0.19% SUZB3 41.33 ▲ 2.35% RENT3 34.68 ▼ 0.09% AZZA3 15.89 ▼ 2.63% CSAN3 3.22 ▼ 1.83% RAIZ4 0.25 — 0.00% PCAR3 2.75 ▼ 0.36% GMAT3 3.65 ▼ 1.08% PSSA3 48.13 ▼ 0.54% CVCB3 1.33 ▼ 2.92% POSI3 3.36 ▲ 2.44% SLCE3 13.34 ▲ 0.30% NATU3 8.14 ▼ 0.73%
since 2009
Monday, August 31, 2026

Agri Business Brazil

São Paulo’s Agribusiness Surplus Shrinks, but State Holds Lead in Brazil’s Export Market

By · April 20, 2025 · 2 min read

Daily Brief

The morning intel from across Latin America. Free.

By subscribing you agree to our privacy policy. We never share your email.

São Paulo’s agribusiness sector posted a US$4.9 billion trade surplus in the first quarter of 2025, according to official state and agricultural research sources.

The figure marks a 19.9% drop from the previous year, reflecting a mix of market pressures and shifting trade dynamics.

Despite the setback, São Paulo remains Brazil’s top exporter of agricultural goods, highlighting the sector’s resilience and strategic role in the state economy.

Exports from São Paulo’s agribusiness reached US$6.40 billion, down 14.6% from the same period in 2024. Imports rose to US$1.50 billion, a 9.5% increase year-over-year.

The sector accounted for 41.7% of all state exports, while agribusiness imports made up 6.8% of total imports.

The drop in surplus stems mainly from weaker international prices and a sharp fall in sugar exports, São Paulo’s leading commodity.
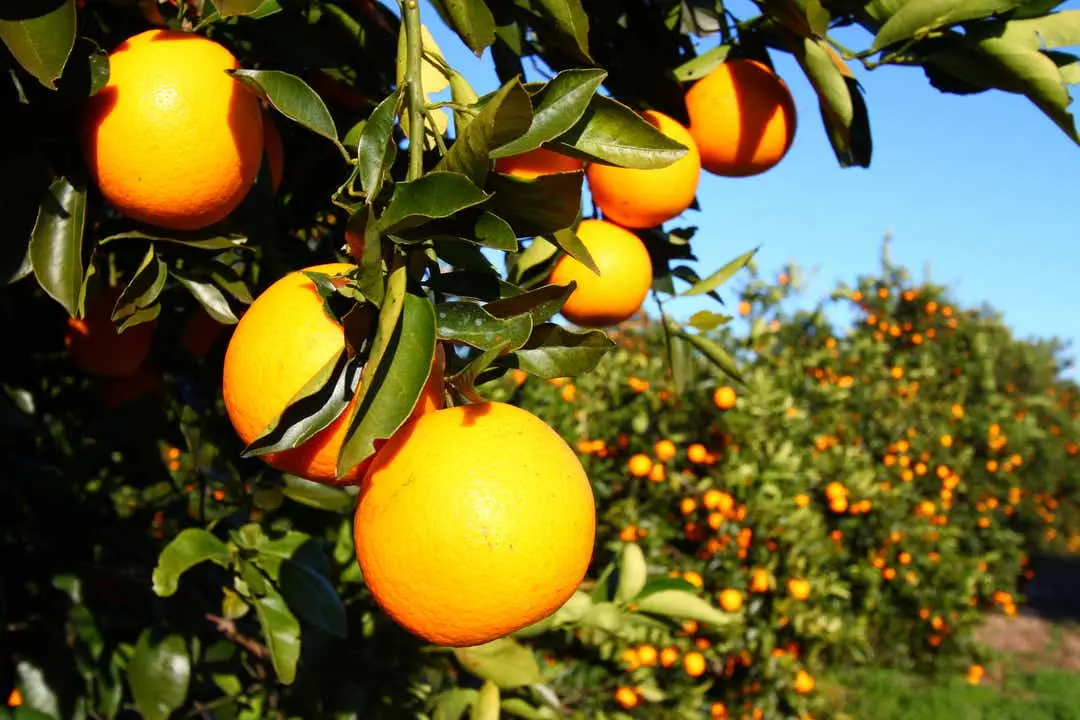
São Paulo's Citrus Crisis Spurs Strategic Shifts in Brazilian Agriculture
São Paulo’s Agribusiness Surplus Shrinks, but State Holds Lead in Brazil’s Export Market. (Photo Internet reproduction)
One-stop reference
Company Intelligence
Every listed company in Latin America — financials, ownership and structure for 1,450+ companies across 26 exchanges, in one place.
Browse the directory →
RT
Ask Rio Times
Latin American markets, currencies and companies.
Open the full Ask Rio Times →

Higher global supply from India, Thailand, and the European Union, combined with a stronger real, prompted producers to favor the domestic market, where prices offered better returns.

The sugar and ethanol complex led São Paulo’s export groups, representing 25.8% (US$1.65 billion) of agribusiness exports.

Sugar made up 88.7% of this group, with ethanol at 11.3%. The meat sector followed, accounting for 13.9% (US$887.91 million), with beef representing 82.5%.

Orange juice exports totaled US$863.07 million, making up 13.5% of the state’s agribusiness exports.

Forestry products contributed 11.9% (US$758.98 million), while the soy complex brought in 7.9% (US$507.27 million).

Coffee ranked sixth, with a 7.3% share (US$465.75 million), led by green and soluble coffee.

São Paulo’s Agribusiness Surplus Shrinks, but State Holds Lead in Brazil’s Export Market

China remained the top destination for São Paulo’s agribusiness, taking 19.3% of exports, mainly soy, meat, and forestry products.

The European Union and United States followed, with 16.4% and 15.9% shares, respectively.

São Paulo’s shipments to China fell by 12.6%, but exports to the EU and US rose by 34.4% and 27.7%.

Nationally, Brazil’s agribusiness exports grew 2.1% to US$37.83 billion in the quarter, with São Paulo responsible for 16.9% of the total.

The state’s performance, though dampened by global competition and price changes, underscores the enduring strength of its diversified agribusiness sector.

This resilience continues to anchor São Paulo’s economy and supports Brazil’s trade balance.


This article was drafted with automated assistance and reviewed before publication. How we use AI · Report an error

Read More from The Rio Times

The Rio Times · Power Map
See who really holds power in Latin America
Click to open the Power Map

Rotate for Best Experience

This report is optimized for landscape viewing. Rotate your phone for the full experience.