IBOV 170,934.30 ▲ 1.79% IPSA 11,379.66 ▲ 1.26% IPC MEX 65,223.89 ▲ 1.36% MERVAL 2,904,791 ▲ 1.00% COLCAP 2,465.35 ▲ 0.86% BVL PERÚ 58,698.13 ▲ 2.27% USD/BRL5.14▼ 1.09% USD/MXN16.92▼ 0.22% USD/CLP914.48▼ 0.83% USD/COP3,036▼ 0.49% USD/PEN3.35▼ 0.05% USD/ARS1,499▲ 0.12% USD/UYU40.20▲ 1.58% USD/PYG5,996▲ 1.55% USD/BOB11.43▲ 0.41% USD/DOP58.82▲ 0.20% USD/CRC450.05▲ 3.34% USD/GTQ7.62▲ 2.21% USD/HNL26.81▲ 0.31% USD/NIO36.62▲ 0.29% USD/VES778.00▼ 0.13% USD/PAB1.00— 0.00% USD/BZD2.00— 0.00% USD/JMD 157.28 — 0.00% USD/TTD6.71▲ 0.79% EUR/BRL6.00▼ 0.58% BRENT 88.88 ▼ 0.03% WTI 83.11 ▼ 0.11% IRON ORE 161.91 — — COPPER 6.61 ▲ 0.03% GOLD 4,461 ▲ 1.78% SILVER 65.59 ▲ 1.26% SOY 1,184 ▲ 3.20% CORN 480.50 ▲ 10.02% WHEAT 655.00 ▲ 3.93% COFFEE 317.25 ▼ 5.51% SUGAR 16.43 ▼ 1.79% ORANGE JUICE 138.55 ▼ 0.47% COTTON 85.03 ▲ 2.33% COCOA 5,719 ▲ 3.18% BEEF 223.60 ▼ 3.93% CATTLE 339.10 ▼ 3.16% LITHIUM 75.20 ▲ 1.47% PETR4 41.64 ▼ 0.05% VALE3 72.97 ▲ 0.83% ITUB4 38.60 ▼ 1.03% BBDC4 16.85 ▲ 0.36% ABEV3 14.89 ▼ 0.80% BBAS3 19.37 ▲ 0.47% B3SA3 14.26 ▼ 0.21% WEGE3 47.59 ▲ 0.49% PRIO3 59.14 ▼ 0.19% SUZB3 41.33 ▲ 2.35% RENT3 34.68 ▼ 0.09% AZZA3 15.89 ▼ 2.63% CSAN3 3.22 ▼ 1.83% RAIZ4 0.25 — 0.00% PCAR3 2.75 ▼ 0.36% GMAT3 3.65 ▼ 1.08% PSSA3 48.13 ▼ 0.54% CVCB3 1.33 ▼ 2.92% POSI3 3.36 ▲ 2.44% SLCE3 13.34 ▲ 0.30% NATU3 8.14 ▼ 0.73% IBOV 170,934.30 ▲ 1.79% IPSA 11,379.66 ▲ 1.26% IPC MEX 65,223.89 ▲ 1.36% MERVAL 2,904,791 ▲ 1.00% COLCAP 2,465.35 ▲ 0.86% BVL PERÚ 58,698.13 ▲ 2.27% USD/BRL 5.16 ▲ 0.01% USD/MXN 17.06 ▼ 0.24% USD/CLP 913.98 ▲ 0.04% USD/COP 3,140 ▲ 0.03% USD/PEN 3.36 ▼ 0.66% USD/ARS 1,493 ▲ 0.10% USD/UYU 40.27 ▲ 1.24% USD/PYG 5,939 ▲ 1.68% USD/BOB 11.64 ▼ 0.76% USD/DOP 58.34 ▲ 1.25% USD/CRC 445.92 ▲ 0.89% USD/GTQ 7.62 ▲ 2.21% USD/HNL 26.79 ▲ 1.57% USD/NIO 36.62 ▲ 0.69% USD/VES 762.44 ▼ 0.13% USD/PAB 1.00 — 0.00% USD/BZD 2.00 — 0.00% USD/JMD 157.28 — 0.00% USD/TTD 6.70 ▲ 0.61% EUR/BRL 5.95 ▲ 1.01% BRENT 88.88 ▼ 0.03% WTI 83.11 ▼ 0.11% IRON ORE 161.91 — — COPPER 6.61 ▲ 0.03% GOLD 4,461 ▲ 1.78% SILVER 65.59 ▲ 1.26% SOY 1,184 ▲ 3.20% CORN 480.50 ▲ 10.02% WHEAT 655.00 ▲ 3.93% COFFEE 317.25 ▼ 5.51% SUGAR 16.43 ▼ 1.79% ORANGE JUICE 138.55 ▼ 0.47% COTTON 85.03 ▲ 2.33% COCOA 5,719 ▲ 3.18% BEEF 223.60 ▼ 3.93% CATTLE 339.10 ▼ 3.16% LITHIUM 75.20 ▲ 1.47% PETR4 41.64 ▼ 0.05% VALE3 72.97 ▲ 0.83% ITUB4 38.60 ▼ 1.03% BBDC4 16.85 ▲ 0.36% ABEV3 14.89 ▼ 0.80% BBAS3 19.37 ▲ 0.47% B3SA3 14.26 ▼ 0.21% WEGE3 47.59 ▲ 0.49% PRIO3 59.14 ▼ 0.19% SUZB3 41.33 ▲ 2.35% RENT3 34.68 ▼ 0.09% AZZA3 15.89 ▼ 2.63% CSAN3 3.22 ▼ 1.83% RAIZ4 0.25 — 0.00% PCAR3 2.75 ▼ 0.36% GMAT3 3.65 ▼ 1.08% PSSA3 48.13 ▼ 0.54% CVCB3 1.33 ▼ 2.92% POSI3 3.36 ▲ 2.44% SLCE3 13.34 ▲ 0.30% NATU3 8.14 ▼ 0.73%
since 2009
Friday, August 21, 2026

Paraná leads Brazil in urban services and quality of life, while northern regions struggle

By · August 5, 2023 · 2 min read

Daily Brief

The morning intel from across Latin America. Free.

By subscribing you agree to our privacy policy. We never share your email.

A study conducted by Bright Cities, a platform that assesses urban services provided by municipalities, has identified Paraná as the Brazilian state with the best indicators for urban services and quality of life.

São Paulo claims the second spot, followed closely by Santa Catarina, Minas Gerais, the Federal District, and Tocantins.

In contrast, the cities of Acre and Amapá lag behind in providing services that reflect positively on their citizens’ quality of life.

The research evaluated cities with more than 100,000 inhabitants, based on 2021 data from the Brazilian Institute of Geography and Statistics (IBGE).
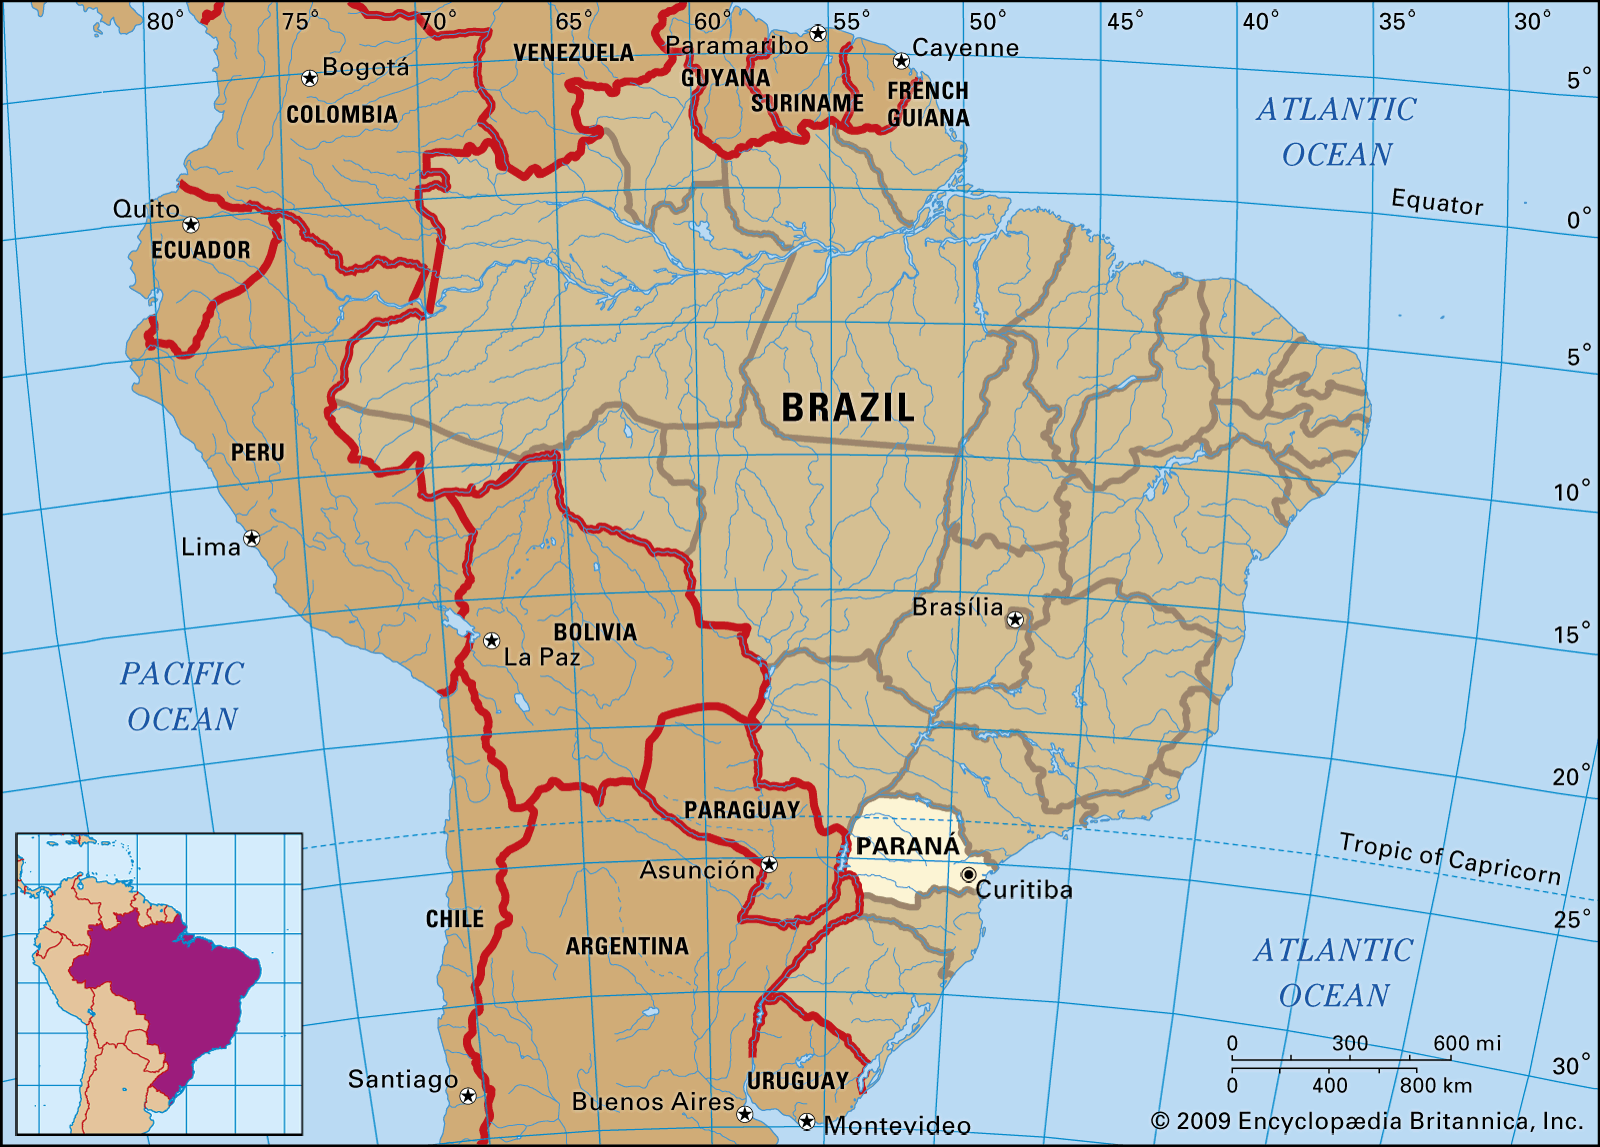
Photo Internet reproduction.
One-stop reference
Company Intelligence
Every listed company in Latin America — financials, ownership and structure for 1,450+ companies across 26 exchanges, in one place.
Browse the directory →
RT
Ask Rio Times
17 years of Latin America reporting, on demand.
Open the full Ask Rio Times →

It audited 40 key and supporting indicators and ranked the top five cities in each region of Brazil.

According to Bright Cities CEO Raquel Cardamone, the study aims to diagnose and suggest solutions that can enhance public management efficiency and decision-making accuracy, gradually transforming cities of any size or nationality into smart cities.

A ranking of states was also created based on the average scores of the three largest cities in each state.

Paraná topped this list. Meanwhile, the state of São Paulo houses cities with the highest indicators in Brazil, occupying the first seven positions in the ranking.

In the overall ranking, Northern Brazil requires the most improvement.

Its 31 cities with populations over 100,000 achieved an average score of 4.74, while Paraná scored 6.48 on average.

Amapá was the state with the worst indicators, considering only its two cities with more than 100,000 inhabitants: Macapá and Santana.

Cities with higher GDP per capita tend to perform better in indicators.

Yet, Cardamone noted this isn’t a universal rule as some high GDP per capita cities rank lower and vice versa.

Capital cities generally tend to perform above their state’s average, and mid-sized cities often combine qualities of small and large cities, such as high quality of life and robust services and infrastructures.

This article was produced by The Rio Times’ automated newsroom system. How we use AI · Report an error

Read More from The Rio Times

The Rio Times · Power Map
See who really holds power in Latin America
Click to open the Power Map

Rotate for Best Experience

This report is optimized for landscape viewing. Rotate your phone for the full experience.