Iron Ore Prices Tumble: A Reflection of China’s Economic Woes
Iron ore futures on China’s Dalian Commodity Exchange took a sharp dive Tuesday, marking their most significant drop in nearly two years.
Disheartening economic data from China led to this decline, overshadowing the demand outlook. Meanwhile, strong global supply continued to suppress prices.
On that day, the most traded January contract fell by 4.74% to close at 703.5 yuan (about $98.87) per ton.
This was the steepest decrease since October 31, 2022. During the session, prices briefly reached 700 yuan, hitting their lowest point since August 19.
The downturn affects stocks of Brazilian mining and steel companies. For instance, Vale’s ADRs were trading nearly 3% lower in early trading in New York.
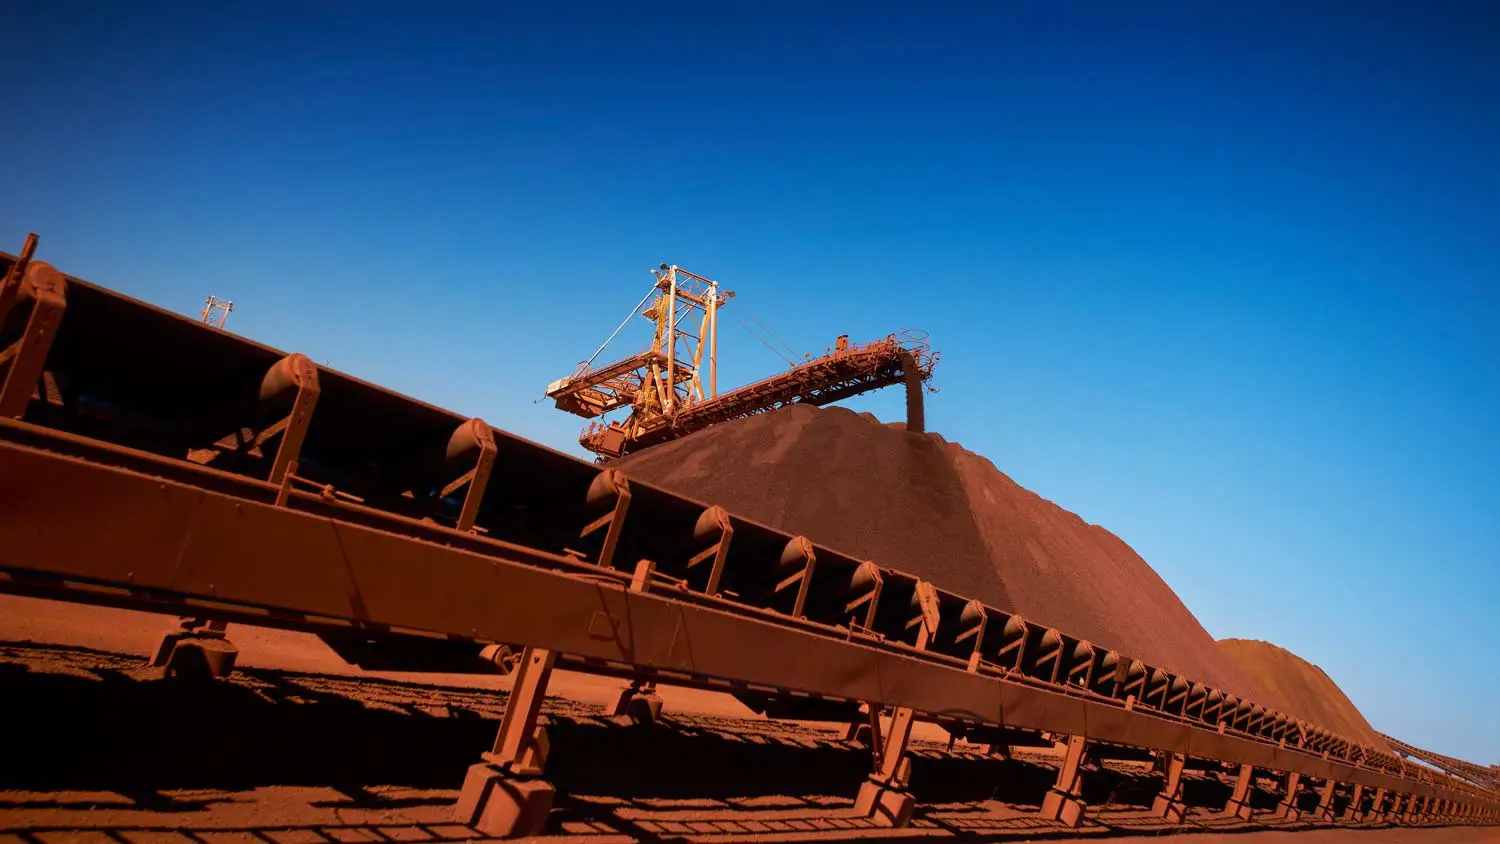
Falling iron ore prices stem from weak demand in China, exacerbated by a continuous decline in manufacturing.
Analysts from ANZ highlighted this issue, noting the industrial slowdown. China’s manufacturing activity dropped to a six-month low in August, pushing policymakers to consider more supportive measures.
In real estate, the rise in new home prices in August was modest, underscoring a sluggish recovery despite governmental support.
Meanwhile, iron ore shipments from Australia and Brazil saw a significant increase. Mysteel reported a 10.9% week-over-week rise in shipments, totaling 29 million tons.
Notably, Brazilian shipments surged by 39% from the previous week, their highest since 2019.
This substantial fall in iron ore prices signals broader economic challenges within China, potentially impacting global markets.
It highlights how deeply intertwined global economies are with commodity prices and the overarching health of the global economy.
More: Brazil news in English, every day from The Rio Times.
Live Market IntelligenceBrazil — Live Market Board
Rio Times · Live Market Intelligence
Brazil — Live Market Board
+0.54%
205,430.33
+0.54%
68,929.72
+1.87%
10,970.29
-0.01%
2,848,945
-0.35%
2,566.28
-0.55%
60,210.69
-0.91%
| Instrument | Last | Change | YoY | Prev. | High | Low | Volume |
|---|---|---|---|---|---|---|---|
| IBOV | 205,430.33 | +0.54% | +21.85% | 204,324.26 | 168,310 | 167,142 | — |
| USD/BRL | 5.16 | +0.01% | -5.13% | 5.16 | 5.18 | 5.14 | — |
| SELIC | 14.00% | — | — | — | — | — | |
| PETR4 | 41.64 | -0.05% | +35.19% | 41.66 | 41.97 | 41.15 | 41,499,400 |
| VALE3 | 72.97 | +0.83% | +30.75% | 72.37 | 73.54 | 72.66 | 17,658,000 |
| ITUB4 | 38.60 | -1.03% | +4.57% | 39.00 | 39.34 | 38.39 | 29,487,800 |
| BBDC4 | 16.85 | +0.36% | +3.50% | 16.79 | 16.90 | 16.67 | 19,416,900 |
| BBAS3 | 19.37 | +0.47% | +0.73% | 19.28 | 19.44 | 19.16 | 11,069,200 |
| B3SA3 | 14.26 | -0.21% | +12.73% | 14.29 | 14.47 | 14.11 | 33,037,800 |
| ABEV3 | 14.89 | -0.80% | +21.91% | 15.01 | 15.07 | 14.81 | 16,453,100 |
| WEGE3 | 47.59 | +0.49% | +29.99% | 47.36 | 48.08 | 47.36 | 3,364,600 |
| PRIO3 | 59.14 | -0.19% | +50.67% | 59.25 | 59.81 | 58.74 | 3,325,600 |
| SUZB3 | 41.33 | +2.35% | -23.55% | 40.38 | 41.48 | 40.35 | 3,914,900 |
| RENT3 | 34.68 | -0.09% | +0.84% | 34.71 | 34.96 | 34.35 | 7,979,100 |
| AZZA3 | 15.89 | -2.63% | -53.76% | 16.32 | 16.42 | 15.82 | 1,330,300 |
| CSNA3 | 4.30 | +0.47% | -42.65% | 4.28 | 4.41 | 4.26 | 10,076,100 |
| GGBR4 | 24.69 | +2.19% | +51.38% | 24.16 | 24.85 | 24.18 | 7,047,600 |
| ENEV3 | 24.21 | -1.38% | +70.49% | 24.55 | 24.64 | 23.99 | 9,297,000 |
This article was produced by The Rio Times’ automated newsroom system. How we use AI · Report an error · Editorial responsibility: Matthias Camenzind, Editor-in-Chief
LatAm Markets: Live Signals → — real-time movers, turnover leaders and FX across Latin America.