Copper Slips as China Cools; Chile, Peru Keep Floor
Key Facts
- CPER fell 0.78% to US$39.67, making it the clearest proxy for the day’s retreat in copper futures rather than physical metal.
- Southern Copper slid 3.00% to US$209.80, a sharper move than the futures market, as investors recalibrated producer exposure to near-term demand.
- Freeport-McMoRan dropped 2.51% to US$76.45, tracking the broader copper complex lower after a week of policy-driven caution.
- COMEX December copper settled down 0.45% at US$6.6590 per pound, while the front-month contract ended the week 0.38% lower.
- Chile and Peru remain the supply anchor with ageing mines and delayed expansions keeping the market structurally tight even as demand cools.
- Chinese cathode rod operating rates softened and import premiums narrowed, signalling that high prices are restraining near-term buying.
Today’s Focus
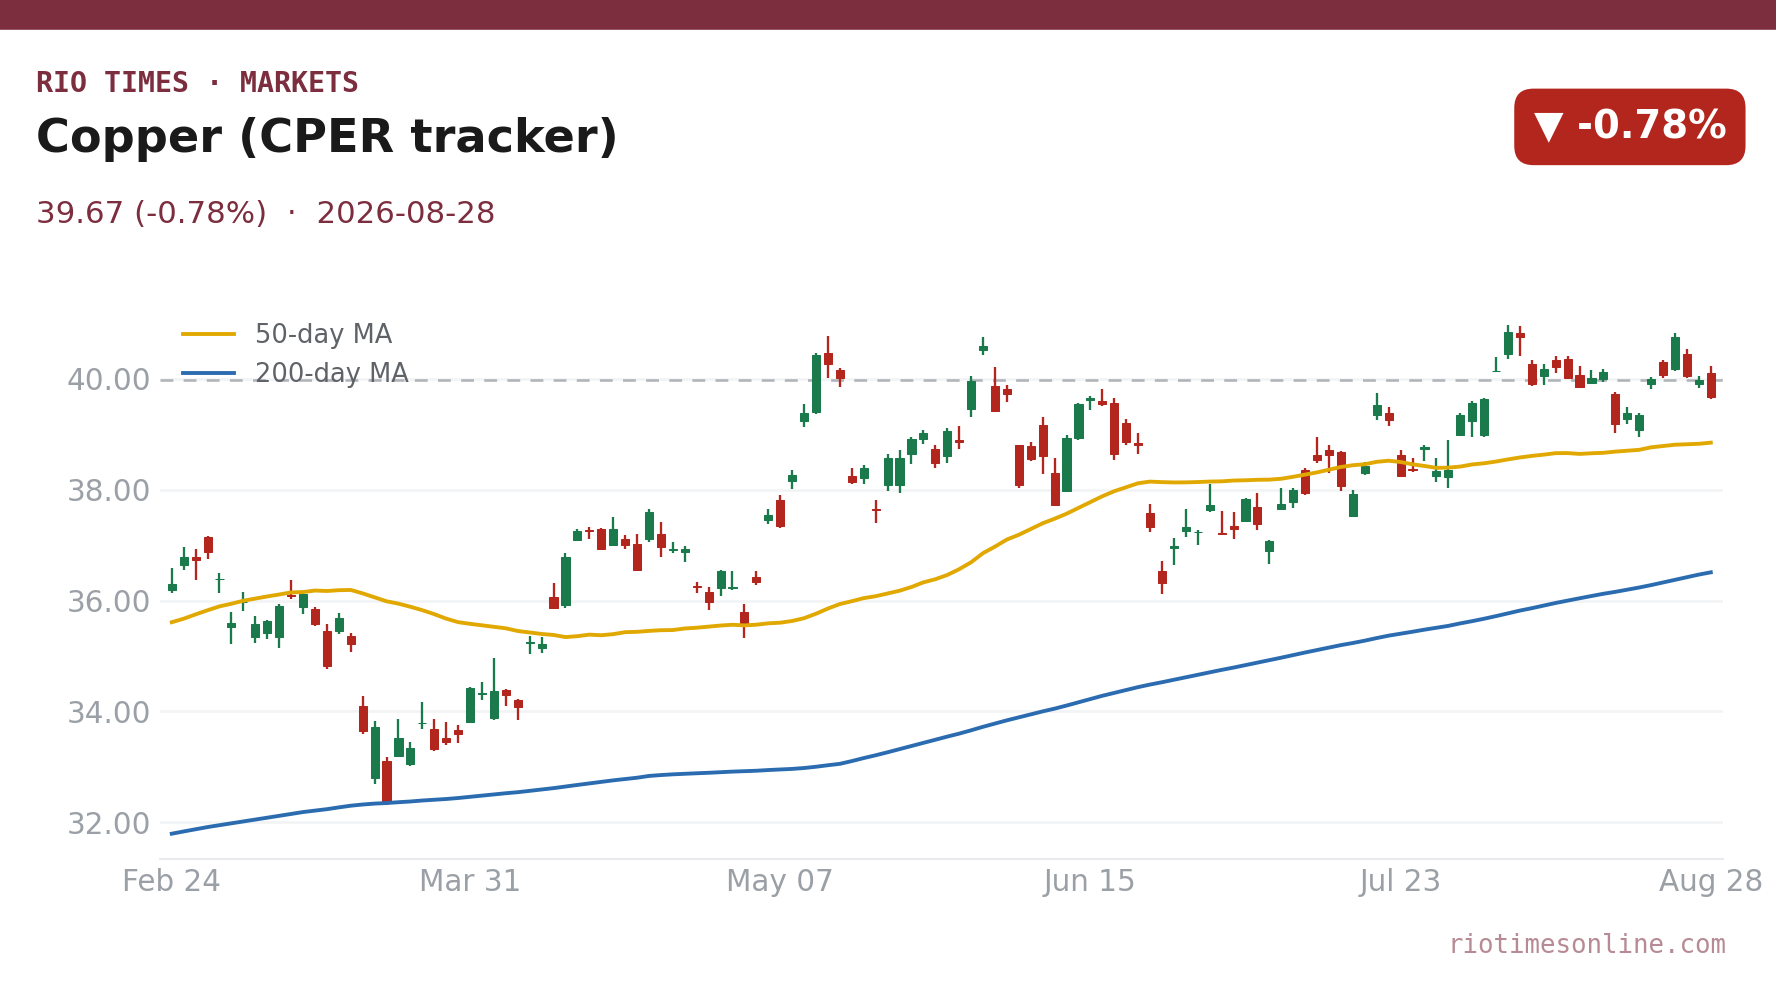
Copper eased on Friday, August 28, 2026, as cooling Chinese fabrication data and heavy COMEX deliveries outweighed the supply constraints that have kept the market structurally tight. The United States Copper Index Fund, CPER, closed at US$39.67, down 0.78%, tracking futures rather than spot metal.
Southern Copper fell 3.00% to US$209.80 and Freeport-McMoRan lost 2.51% to US$76.45, a sign that equity investors were more cautious than the futures market about near-term demand. The December COMEX contract settled at US$6.6590 per pound, down 0.45%.
Behind the drift lies a familiar tension: China’s fabrication activity is softening, while mine supply from Chile and Peru stays below expectations. That mismatch has stopped prices from falling harder, but it has not been enough to push them higher this session.
What matters today. Copper is caught between weak near-term Chinese buying and durable supply tightness from the world’s two largest producers, Chile and Peru.
01 The session in one read
Copper drifted lower on Friday, August 28, 2026, as investors weighed softer Chinese fabrication indicators against a stubbornly tight mine supply picture in Latin America. The CPER fund, which tracks copper futures rather than physical metal, closed at US$39.67, down 0.78%.
The move was modest compared with the sharper drops in producer shares: Southern Copper fell 3.00% to US$209.80, while Freeport-McMoRan lost 2.51% to US$76.45. The December COMEX copper contract settled at US$6.6590 per pound, down 0.45% on the day, and the front-month contract ended the week 0.38% lower.
Copper looks set to trade sideways until Chinese demand gives a clearer signal, with the structural tightness in Chilean and Peruvian mine supply preventing a deeper slide. Watch Chinese import premiums and cathode rod operating rates for the first sign of renewed buying.
02 The board
The price board tells a story of equity investors more nervous than futures traders. CPER’s 0.78% decline to US$39.67 was tame, yet Southern Copper and Freeport-McMoRan fell by 3.00% and 2.51% respectively, suggesting shareholders are pricing in a softer demand outlook for miners.
All three proxies point the same direction, but the gap between their moves matters. The futures market is anchored by physical tightness, while producer stocks reflect worries about margins if Chinese buying stays muted and treatment charges remain at or below zero.
| Asset | Level | Change |
|---|---|---|
| Copper (CPER tracker) | US$39.67 | -0.78% |
| Southern Copper | US$209.80 | -3.00% |
| Freeport-McMoRan | US$76.45 | -2.51% |
Source: RT close, 2026-08-28. Where a commodity has no spot feed, an exchange-traded tracker or leading producer is shown as a labelled proxy.
Live Market IntelligenceThe live market board
Rio Times · Live Market Intelligence
Latin America — Cross-Market Board
| Instrument | Last | Change | YoY | Prev. | High | Low | Volume |
|---|---|---|---|---|---|---|---|
| IBOV | 206,505.98 | -0.18% | +21.85% | 206,887.52 | 168,310 | 167,142 | — |
| IPSA | 10,966.21 | -0.49% | — | 11,020.01 | 11,210 | 10,984 | 1,513,213,483 |
| IPC MEX | 66,790.35 | -0.26% | +12.17% | 66,965.15 | 66,121 | 65,405 | 108,886,187 |
| MERVAL | 2,835,843 | +0.00% | +30.51% | 3,022,485 | 3,042,365 | 2,991,150 | — |
| COLCAP | 2,582.29 | +0.46% | — | 9.04 | 9.05 | 9.02 | 4,133 |
| BVL PERÚ | 60,511.74 | -1.60% | — | — | — | — | — |
| USD/BRL | 5.16 | +0.01% | -5.13% | 5.16 | 5.18 | 5.14 | — |
| EUR/BRL | 5.95 | +1.01% | -5.83% | 5.89 | 5.98 | 5.94 | — |
| USD/MXN | 17.06 | -0.24% | -8.58% | 17.10 | 17.08 | 17.01 | — |
| USD/CLP | 913.98 | +0.04% | -5.67% | 913.65 | 915.11 | 906.68 | — |
| USD/COP | 3,140 | +0.03% | -22.04% | 3,139 | 3,141 | 3,105 | — |
| USD/PEN | 3.36 | -0.66% | -4.82% | 3.38 | 3.38 | 3.35 | — |
| USD/ARS | 1,493 | +0.10% | +12.96% | 1,491 | 1,494 | 1,480 | — |
| USD/UYU | 40.27 | +1.24% | +1.80% | 39.77 | 40.27 | 40.23 | — |
| USD/PYG | 5,939 | +1.68% | -19.54% | 5,841 | 5,939 | 5,925 | — |
| USD/BOB | 11.64 | -0.76% | +72.04% | 11.73 | 11.72 | 11.64 | — |
| USD/DOP | 58.34 | +1.25% | -3.44% | 57.62 | 58.34 | 58.04 | — |
| USD/CRC | 445.92 | +0.89% | -9.71% | 441.97 | 448.50 | 445.92 | — |
03 What moved it
China was the key short-term driver. Cathode rod operating rates have softened and import premiums have narrowed, a classic sign that high prices are discouraging Chinese fabricators from restocking.
Heavy COMEX delivery activity added to the soft tone: 12,753 copper contracts, each representing 25,000 pounds, were stopped in August 2026 across 20 firms. That heavy movement of metal into physical hands suggested ample near-term availability even as mine supply stays tight.
04 The Latin American read
Chile and Peru, the world’s top two copper producers, remain the story underneath every price move. Chilean production is stuck near 5.5 million tonnes against a 6-million-tonne target, and Codelco has delayed its Andes Norte expansion to 2029.
That structural tightness is stopping a deeper slide. Treatment and refining charges have fallen to zero or below, with Antofagasta agreeing zero processing charges with a Chinese smelter, squeezing smelter margins and forcing output cuts that tighten the refined market.
05 The names to watch
Southern Copper’s 3.00% drop to US$209.80 makes it the most sensitive large-cap proxy for the Latin American supply story. Investors should watch whether its next move tracks copper futures more closely or continues to overshoot on demand fears.
Freeport-McMoRan, down 2.51% to US$76.45, adds a global dimension, with its Grasberg operations and US exposure making it a bellwether for how miners navigate both energy transition demand and policy uncertainty.
06 The outlook
The week ahead hinges on Chinese import data and any signs that fabricators are returning to the market after the recent price softness. If import premiums keep narrowing, the path of least resistance remains lower in the near term, though the supply floor from Chile and Peru is unlikely to break easily.
07 What to watch
- Chinese import premiums: A further narrowing would confirm weak restocking demand and pressure prices.
- COMEX delivery activity: Continued heavy deliveries would signal ample near-term metal availability despite tight mine supply.
- Chilean production data: Any sign of output recovering toward 5.5 million tonnes or above could soften the supply narrative.
- Treatment charges: If charges stay at or below zero, smelter cuts will tighten refined supply and support prices.
Frequently Asked Questions
Why did copper fall on Friday, August 28, 2026?
Softer Chinese fabrication indicators and heavy COMEX deliveries outweighed supply tightness, with CPER down 0.78% to US$39.67.
Why did Southern Copper and Freeport fall more than copper futures?
Producer stocks fell 3.00% and 2.51% respectively because investors priced in margin pressure from weak Chinese buying and low treatment charges.
Does CPER track physical copper or futures?
CPER tracks copper futures, not spot metal, making it a proxy for the futures market rather than the physical commodity.
What is keeping copper from falling further?
Structural mine supply tightness in Chile and Peru, ageing mines and delayed expansions are providing a floor under prices.
Market data: RT
This article was produced by The Rio Times’ automated newsroom system. How we use AI · Report an error · Editorial responsibility: Matthias Camenzind, Editor-in-Chief
In depth
LatAm Markets: Live Signals → — real-time movers, turnover leaders and FX across Latin America.
Copper in Latin America
- What Is Codelco? Chile’s State Copper Giant, Its Debt and the El Teniente Crisis
- Peru Copper Mining Explained: Output, Big Mines, Exports and Risks in 2026
- Peru Natural Resources Explained 2026
- Who Runs Chile’s Economy, the Key Players in 2026