Chinese Car Exports Top One Million a Month as Home Sales Slide
China · COMPANIES
Key Facts
—Chinese car export surge: Up about 300 percent between 2021 and 2024, making China the largest exporter by units.
—Domestic slowdown: Retail sales fell 20.9 percent in July 2026 to 1.461 million units; January to July down 20.5 percent.
—BYD pivot: BYD sold 100,600 units overseas in February 2026, about 53 percent of total; mainland sales fell 65 percent.
—Great Wall milestone: Great Wall Motor’s overseas sales first passed domestic in February 2026; exports 42,679 of 72,594 units.
—Africa used cars: 222,000 Chinese vehicles from January to May 2025, up 67 percent.
—Western tariffs: EU duties of 7.8 to 35.3 percent from late October 2024; Brussels now weighs minimum import prices.
Chinese car exports topped one million units in a single month for the first time in July 2026. Home sales fell 21.1 percent, pushing makers toward Brazil and Africa.
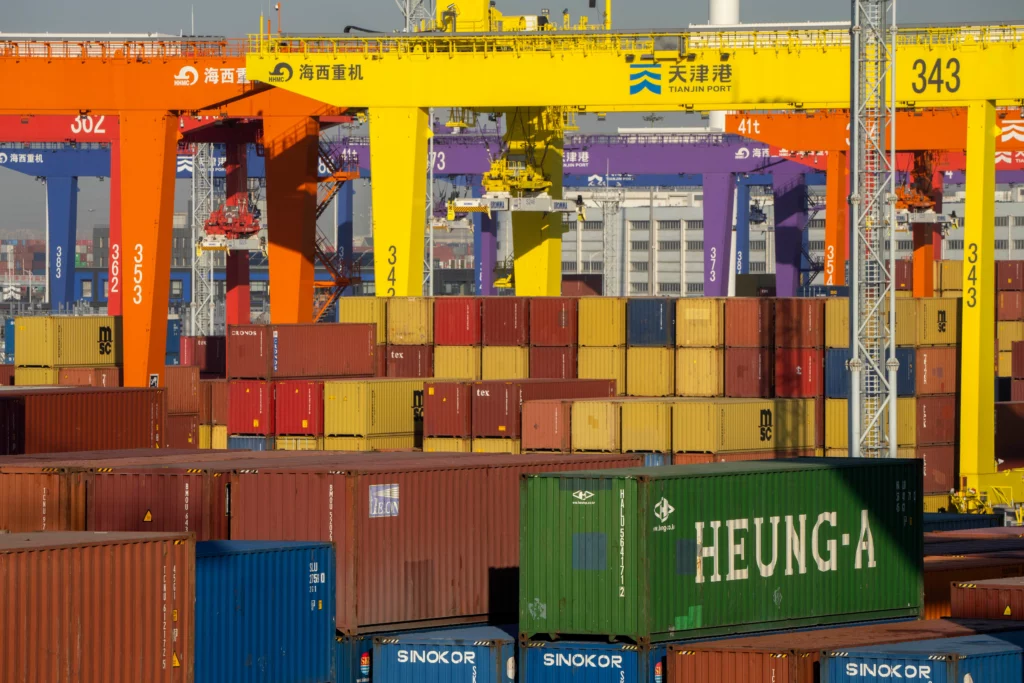
The export engine behind Chinese car sales
Between 2021 and 2024, the number of cars shipped from China rose by about 300 percent. The China Passenger Car Association reported auto exports of 4.8 million units in 2024, up about 25 percent from the previous year.
That performance kept China ahead of Japan as the world’s largest car exporter by units. It was the second consecutive year.
Yet the domestic picture tells a different story. Passenger vehicle retail sales fell 21.1 percent in July 2026, the China Passenger Car Association said.
Reuters reported domestic passenger vehicle sales dropped 5.8 percent in April 2024. Exports jumped 38 percent to 417,000 units in the same month.
Africa: a fast-growing frontier for Chinese car sales
BYD and Great Wall Motor lead the overseas pivot
Corporate results from early 2026 show how central exports have become. BYD is the world’s largest electric vehicle maker.
Overall BYD sales fell 41 percent from a year earlier, driven by a 65 percent collapse in mainland China sales. Lunar New Year fell in February 2026 but January 2025, which exaggerates the gap.
Great Wall Motor reached a milestone in February 2026, when overseas sales exceeded domestic deliveries for the first time. Of 72,594 vehicles sold, 42,679 went to overseas markets, about 59 percent of the total.
Fierce domestic competition and repeated price cuts are squeezing Chinese carmakers. Regulators summoned automakers in June 2026 over what they called irrational competition.
Western tariffs push China toward the Global South
The European Union launched an anti-subsidy investigation into Chinese electric vehicles in October 2023. Additional tariffs on China-made electric vehicles followed in late October 2024.
Those measures did not shut China out of Europe. Chinese brands took a record 14.2 percent of western Europe’s battery car market in early 2026.
The pivot has gone to Latin America first, not Africa. Brazil became China’s biggest car export market by value in the first five months of 2026.
This shift fits the pattern covered in Africa: The New Scramble. Chinese industrial policy is reshaping the continent.
The domestic slowdown driving Chinese car sales abroad
China’s home market has turned from slow growth into steep decline. Petrol and diesel car sales fell 17 percent in 2024, from 14 million to 11.6 million.
New energy vehicles, meaning battery electric and plug-in hybrid models, still dominate at home. They took a record 65.1 percent of passenger car retail sales in July 2026.
New energy vehicle sales are now falling too, down 3.9 percent in July 2026. Weak consumer confidence, a sluggish economy and property-sector trouble all weigh on demand.
Exports now perform three functions for Beijing: absorbing overcapacity in a strategic sector, supporting employment in industrial provinces, and generating foreign exchange. New energy vehicle exports doubled to 2.62 million units in 2025, lifting China’s total vehicle exports to 7.1 million.
What to watch next in Africa
African policymakers face both opportunities and vulnerabilities. Cheaper vehicles widen access to transport and help logistics.
Heavy reliance on Chinese brands, financing and parts could still create lock-in.
The question is whether African governments secure real industrial partnerships. The alternative is becoming a dumping ground for surplus output.
What Africa can learn from Brazil
Brazil is now China’s largest car export market by value. Imports reached US$5.2 billion from January to May 2026, up 146.9 percent.
Roughly US$4.5 billion of that was electric and hybrid. By units, Brazil ranked fifth in 2025 at 322,076 vehicles.
BYD’s plant at Camaçari in Bahia built its 100,000th vehicle on 16 July 2026. It employs more than 5,500 people.
Brasília raised its electric vehicle import tariff to 35 percent from July 2026 to force local assembly. The import surge was buyers beating that deadline.
Africa’s constraint is different. Fewer than 1,000 public charging points served 26 African countries in early 2025, against more than 600,000 in Europe.
Frequently Asked Questions
Why are Chinese car sales booming abroad but slowing at home?
Chinese home sales fell 20.5 percent in January to July 2026 after subsidy-driven demand was pulled forward. Exports absorb overcapacity and offer higher growth, rising about 300 percent between 2021 and 2024.
Which African countries import the most Chinese cars?
South Africa, Algeria, Egypt, Nigeria and Morocco lead African demand for Chinese vehicles. Africa took 222,000 Chinese vehicles from January to May 2025, up 67 percent.
How are Western tariffs affecting Chinese car exports?
European Union duties of 7.8 to 35.3 percent took effect in late October 2024. Chinese brands still reached a record 14.2 percent of western Europe’s battery car market in 2026.
Connected Coverage
For more on how Chinese industrial policy and infrastructure finance are reshaping African markets, read Africa: The New Scramble.
Sources
This article was produced by The Rio Times’ automated newsroom system. How we use AI · Report an error
Read More from The Rio Times