IBOV 205,835.29 ▼ 0.52% IPSA 11,164.13 ▲ 0.35% IPC MEX 64,975.08 ▲ 0.69% MERVAL 2,896,853 ▲ 0.95% COLCAP 2,589.04 ▲ 0.25% BVL PERÚ 60,220.93 ▲ 0.91% USD/BRL4.98▼ 0.20% USD/MXN17.96▼ 0.68% USD/CLP971.85▼ 0.08% USD/COP3,228▲ 1.07% USD/PEN3.44▼ 0.17% USD/ARS1,520— 0.00% USD/UYU40.09▲ 2.87% USD/PYG5,835▲ 3.25% USD/BOB11.90▲ 2.31% USD/DOP60.36▲ 4.52% USD/CRC454.50▲ 2.57% USD/GTQ7.64▲ 3.36% USD/HNL26.86▲ 3.49% USD/NIO36.62▲ 2.96% USD/VES871.68▲ 0.04% USD/PAB1.00— 0.00% USD/BZD2.00— 0.00% USD/JMD 157.28 — 0.00% USD/TTD6.68▲ 1.99% EUR/BRL5.61▼ 4.51% BRENT 88.88 ▼ 0.03% WTI 83.11 ▼ 0.11% IRON ORE 161.91 — — COPPER 6.61 ▲ 0.03% GOLD 4,461 ▲ 1.78% SILVER 65.59 ▲ 1.26% SOY 1,184 ▲ 3.20% CORN 480.50 ▲ 10.02% WHEAT 655.00 ▲ 3.93% COFFEE 317.25 ▼ 5.51% SUGAR 16.43 ▼ 1.79% ORANGE JUICE 138.55 ▼ 0.47% COTTON 85.03 ▲ 2.33% COCOA 5,719 ▲ 3.18% BEEF 223.60 ▼ 3.93% CATTLE 339.10 ▼ 3.16% LITHIUM 75.20 ▲ 1.47% PETR4 41.64 ▼ 0.05% VALE3 72.97 ▲ 0.83% ITUB4 38.60 ▼ 1.03% BBDC4 16.85 ▲ 0.36% ABEV3 14.89 ▼ 0.80% BBAS3 19.37 ▲ 0.47% B3SA3 14.26 ▼ 0.21% WEGE3 47.59 ▲ 0.49% PRIO3 59.14 ▼ 0.19% SUZB3 41.33 ▲ 2.35% RENT3 34.68 ▼ 0.09% AZZA3 15.89 ▼ 2.63% CSAN3 3.22 ▼ 1.83% RAIZ4 0.25 — 0.00% PCAR3 2.75 ▼ 0.36% GMAT3 3.65 ▼ 1.08% PSSA3 48.13 ▼ 0.54% CVCB3 1.33 ▼ 2.92% POSI3 3.36 ▲ 2.44% SLCE3 13.34 ▲ 0.30% NATU3 8.14 ▼ 0.73% IBOV 205,835.29 ▼ 0.52% IPSA 11,164.13 ▲ 0.35% IPC MEX 64,975.08 ▲ 0.69% MERVAL 2,896,853 ▲ 0.95% COLCAP 2,589.04 ▲ 0.25% BVL PERÚ 60,220.93 ▲ 0.91% USD/BRL 5.16 ▲ 0.01% USD/MXN 17.06 ▼ 0.24% USD/CLP 913.98 ▲ 0.04% USD/COP 3,140 ▲ 0.03% USD/PEN 3.36 ▼ 0.66% USD/ARS 1,493 ▲ 0.10% USD/UYU 40.27 ▲ 1.24% USD/PYG 5,939 ▲ 1.68% USD/BOB 11.64 ▼ 0.76% USD/DOP 58.34 ▲ 1.25% USD/CRC 445.92 ▲ 0.89% USD/GTQ 7.62 ▲ 2.21% USD/HNL 26.79 ▲ 1.57% USD/NIO 36.62 ▲ 0.69% USD/VES 762.44 ▼ 0.13% USD/PAB 1.00 — 0.00% USD/BZD 2.00 — 0.00% USD/JMD 157.28 — 0.00% USD/TTD 6.70 ▲ 0.61% EUR/BRL 5.95 ▲ 1.01% BRENT 88.88 ▼ 0.03% WTI 83.11 ▼ 0.11% IRON ORE 161.91 — — COPPER 6.61 ▲ 0.03% GOLD 4,461 ▲ 1.78% SILVER 65.59 ▲ 1.26% SOY 1,184 ▲ 3.20% CORN 480.50 ▲ 10.02% WHEAT 655.00 ▲ 3.93% COFFEE 317.25 ▼ 5.51% SUGAR 16.43 ▼ 1.79% ORANGE JUICE 138.55 ▼ 0.47% COTTON 85.03 ▲ 2.33% COCOA 5,719 ▲ 3.18% BEEF 223.60 ▼ 3.93% CATTLE 339.10 ▼ 3.16% LITHIUM 75.20 ▲ 1.47% PETR4 41.64 ▼ 0.05% VALE3 72.97 ▲ 0.83% ITUB4 38.60 ▼ 1.03% BBDC4 16.85 ▲ 0.36% ABEV3 14.89 ▼ 0.80% BBAS3 19.37 ▲ 0.47% B3SA3 14.26 ▼ 0.21% WEGE3 47.59 ▲ 0.49% PRIO3 59.14 ▼ 0.19% SUZB3 41.33 ▲ 2.35% RENT3 34.68 ▼ 0.09% AZZA3 15.89 ▼ 2.63% CSAN3 3.22 ▼ 1.83% RAIZ4 0.25 — 0.00% PCAR3 2.75 ▼ 0.36% GMAT3 3.65 ▼ 1.08% PSSA3 48.13 ▼ 0.54% CVCB3 1.33 ▼ 2.92% POSI3 3.36 ▲ 2.44% SLCE3 13.34 ▲ 0.30% NATU3 8.14 ▼ 0.73%
since 2009
Tuesday, October 6, 2026

Brazil Politics - Brazil

Brazil’s Urban Centers Witness Left’s Worst Performance in Two Decades

By · October 31, 2024 · 2 min read

Left-wing parties in Brazil have recorded their worst performance since 2000 in the country’s largest electoral districts. The recent municipal elections saw PT, PSB, and PDT secure only 9.7% of cities with over 200,000 voters.

This marks a significant decline in their influence across major urban centers. The Workers’ Party (PT), led by President Luiz Inácio Lula da Silva, managed to win just six cities in this category.

This is a stark contrast to their previous stronghold of 22 major cities 24 years ago. PSB and PDT fared even worse, each winning only two municipalities in the group of 103 large cities.

Political scientist Murilo Medeiros from the University of Brasília analyzed this trend. He noted a narrowing of party representation in these key areas.

The number of parties governing cities with over 200,000 voters dropped from 19 in 2020 to 13 in 2024, a 31.5% decrease. Medeiros points to several factors behind the left’s decline.
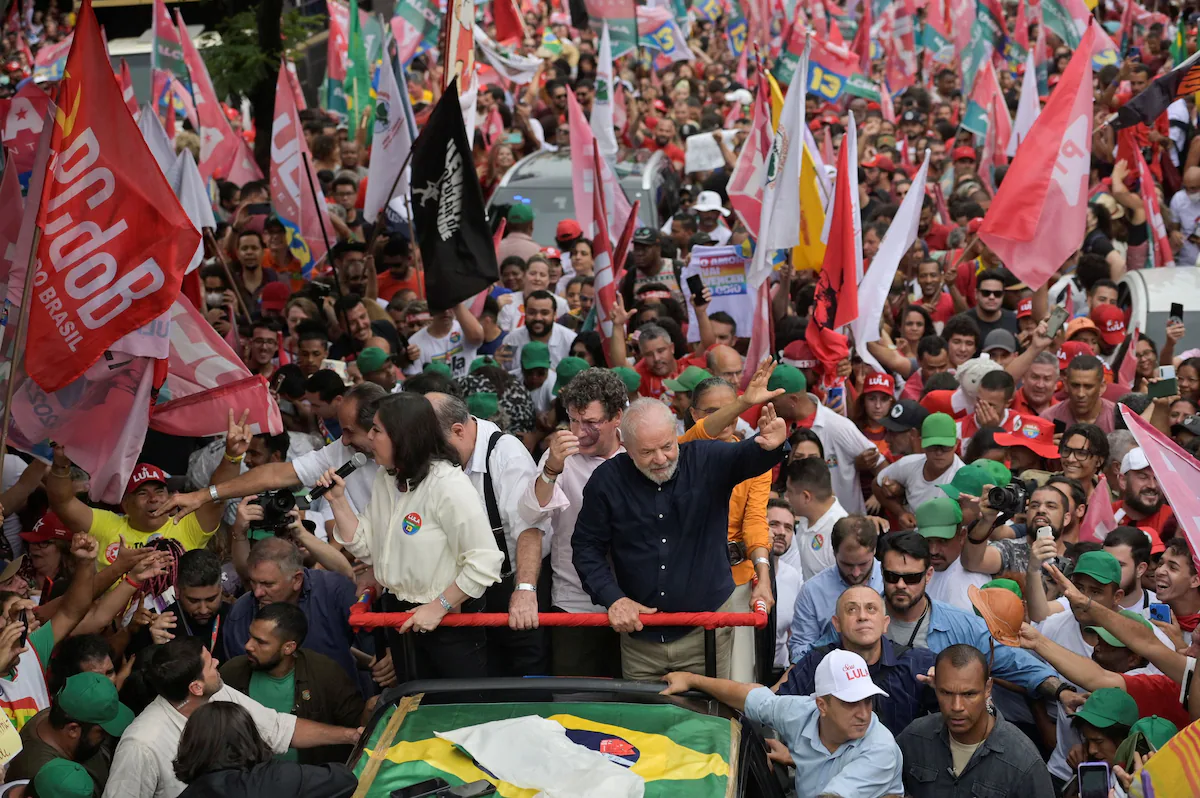
Brazil's Urban Centers Witness Left's Worst Performance in Two Decades
Brazil’s Urban Centers Witness Left’s Worst Performance in Two Decades.
RT
Ask Rio Times
This story and the bigger picture.
Open the full Ask Rio Times →

He suggests they have lost connection with crucial voter segments in urban areas. These include evangelical voters, residents of peripheral neighborhoods, and young people.

The LatAm Brief

One email, every weekday morning. What moved in Latin American markets, politics and expat life.

Yesterday’s subject line: “Brazil stocks jump 7.7%, real up 4%, after the vote”

Free. We send a confirmation link first — nothing arrives until you click it. Unsubscribe with one click in any edition. If you stop opening us for 30 days we stop sending by ourselves, as we assume the interest is no longer there. See our privacy policy. We never share your email.

Brazil’s Political Landscape Shifts Right

The left’s failure to update their platform and address modern issues has contributed to voter disillusionment. In contrast, conservative parties have made significant gains.

The Liberal Party (PL), associated with former President Jair Bolsonaro, now leads in these major cities. It increased its presence from 2 to 16 municipalities, its best performance in recent years.

Other right-leaning parties also showed growth. PSD secured 15 major municipalities, while União Brasil won 14. PP and Republicanos also expanded their influence, with Republicanos doubling its presence and PP increasing by 37.5% compared to the last election.

This shift reflects broader changes in Brazilian society. Medeiros suggests that left-wing parties, rooted in 1980s trade unionist ideologies, struggle to resonate with an increasingly religious Brazil.

They also face challenges connecting with a new middle class that favors entrepreneurship and less state intervention.

The results from these major cities, which represent 40% of Brazil’s electorate, often indicate national political trends. This conservative shift in urban centers could have significant implications for future elections and policy directions in the country.

As Brazil’s political landscape evolves, parties across the spectrum face the challenge of adapting to changing voter preferences.

In short, the left’s setback in major cities highlights the need for political renewal and better engagement with diverse voter groups.

This article was produced by The Rio Times’ automated newsroom system. How we use AI · Report an error · Editorial responsibility: Matthias Camenzind, Editor-in-Chief

The Rio Times · Power Map
See who really holds power in Latin America
Click to open the Power Map →

Rotate for Best Experience

This report is optimized for landscape viewing. Rotate your phone for the full experience.