IBOV 177,418.78 ▲ 1.00% IPSA 11,315.26 ▼ 1.14% IPC MEX 65,430.32 ▼ 0.08% MERVAL 3,033,848 — 0.00% COLCAP 2,425.08 ▼ 1.33% BVL PERÚ 59,928.30 ▼ 0.80% USD/BRL5.18▲ 0.01% USD/MXN17.00▲ 0.05% USD/CLP933.85▼ 0.04% USD/COP3,214▲ 0.39% USD/PEN3.36▼ 0.13% USD/ARS1,509▼ 0.28% USD/UYU40.29▲ 0.05% USD/PYG5,892▼ 0.13% USD/BOB11.84▲ 0.51% USD/DOP58.64▲ 0.05% USD/CRC446.47▼ 0.04% USD/GTQ7.62▼ 0.02% USD/HNL26.84— 0.00% USD/NIO36.62▲ 0.14% USD/VES796.33▲ 0.29% USD/PAB1.00— 0.00% USD/BZD2.00— 0.00% USD/JMD 157.28 — 0.00% USD/TTD6.69▼ 0.37% EUR/BRL6.01▲ 0.03% BRENT 88.88 ▼ 0.03% WTI 83.11 ▼ 0.11% IRON ORE 161.91 — — COPPER 6.61 ▲ 0.03% GOLD 4,461 ▲ 1.78% SILVER 65.59 ▲ 1.26% SOY 1,184 ▲ 3.20% CORN 480.50 ▲ 10.02% WHEAT 655.00 ▲ 3.93% COFFEE 317.25 ▼ 5.51% SUGAR 16.43 ▼ 1.79% ORANGE JUICE 138.55 ▼ 0.47% COTTON 85.03 ▲ 2.33% COCOA 5,719 ▲ 3.18% BEEF 223.60 ▼ 3.93% CATTLE 339.10 ▼ 3.16% LITHIUM 75.20 ▲ 1.47% PETR4 41.64 ▼ 0.05% VALE3 72.97 ▲ 0.83% ITUB4 38.60 ▼ 1.03% BBDC4 16.85 ▲ 0.36% ABEV3 14.89 ▼ 0.80% BBAS3 19.37 ▲ 0.47% B3SA3 14.26 ▼ 0.21% WEGE3 47.59 ▲ 0.49% PRIO3 59.14 ▼ 0.19% SUZB3 41.33 ▲ 2.35% RENT3 34.68 ▼ 0.09% AZZA3 15.89 ▼ 2.63% CSAN3 3.22 ▼ 1.83% RAIZ4 0.25 — 0.00% PCAR3 2.75 ▼ 0.36% GMAT3 3.65 ▼ 1.08% PSSA3 48.13 ▼ 0.54% CVCB3 1.33 ▼ 2.92% POSI3 3.36 ▲ 2.44% SLCE3 13.34 ▲ 0.30% NATU3 8.14 ▼ 0.73% IBOV 177,418.78 ▲ 1.00% IPSA 11,315.26 ▼ 1.14% IPC MEX 65,430.32 ▼ 0.08% MERVAL 3,033,848 — 0.00% COLCAP 2,425.08 ▼ 1.33% BVL PERÚ 59,928.30 ▼ 0.80% USD/BRL 5.16 ▲ 0.01% USD/MXN 17.06 ▼ 0.24% USD/CLP 913.98 ▲ 0.04% USD/COP 3,140 ▲ 0.03% USD/PEN 3.36 ▼ 0.66% USD/ARS 1,493 ▲ 0.10% USD/UYU 40.27 ▲ 1.24% USD/PYG 5,939 ▲ 1.68% USD/BOB 11.64 ▼ 0.76% USD/DOP 58.34 ▲ 1.25% USD/CRC 445.92 ▲ 0.89% USD/GTQ 7.62 ▲ 2.21% USD/HNL 26.79 ▲ 1.57% USD/NIO 36.62 ▲ 0.69% USD/VES 762.44 ▼ 0.13% USD/PAB 1.00 — 0.00% USD/BZD 2.00 — 0.00% USD/JMD 157.28 — 0.00% USD/TTD 6.70 ▲ 0.61% EUR/BRL 5.95 ▲ 1.01% BRENT 88.88 ▼ 0.03% WTI 83.11 ▼ 0.11% IRON ORE 161.91 — — COPPER 6.61 ▲ 0.03% GOLD 4,461 ▲ 1.78% SILVER 65.59 ▲ 1.26% SOY 1,184 ▲ 3.20% CORN 480.50 ▲ 10.02% WHEAT 655.00 ▲ 3.93% COFFEE 317.25 ▼ 5.51% SUGAR 16.43 ▼ 1.79% ORANGE JUICE 138.55 ▼ 0.47% COTTON 85.03 ▲ 2.33% COCOA 5,719 ▲ 3.18% BEEF 223.60 ▼ 3.93% CATTLE 339.10 ▼ 3.16% LITHIUM 75.20 ▲ 1.47% PETR4 41.64 ▼ 0.05% VALE3 72.97 ▲ 0.83% ITUB4 38.60 ▼ 1.03% BBDC4 16.85 ▲ 0.36% ABEV3 14.89 ▼ 0.80% BBAS3 19.37 ▲ 0.47% B3SA3 14.26 ▼ 0.21% WEGE3 47.59 ▲ 0.49% PRIO3 59.14 ▼ 0.19% SUZB3 41.33 ▲ 2.35% RENT3 34.68 ▼ 0.09% AZZA3 15.89 ▼ 2.63% CSAN3 3.22 ▼ 1.83% RAIZ4 0.25 — 0.00% PCAR3 2.75 ▼ 0.36% GMAT3 3.65 ▼ 1.08% PSSA3 48.13 ▼ 0.54% CVCB3 1.33 ▼ 2.92% POSI3 3.36 ▲ 2.44% SLCE3 13.34 ▲ 0.30% NATU3 8.14 ▼ 0.73%
since 2009
Tuesday, September 1, 2026

Brazil Business - Brazil

Brazil’s Trade Surplus: A Detailed Look at May’s Economic Dynamics

By · June 6, 2024 · 2 min read

Daily Brief

The morning intel from across Latin America. Free.

By subscribing you agree to our privacy policy. We never share your email.

In May, Brazil witnessed a trade surplus of $8.534 billion, though this figure shows a sharp 22.3% drop from the previous year’s $11 billion.

The decline reflects broader economic shifts impacting the nation’s trade dynamics.

Export revenues fell to $30.338 billion, a 7.1% decrease from last year, while imports edged up slightly by 0.5% to $21.804 billion.

The fluctuation in trade figures corresponds with significant price changes in both imports and exports. Average prices dipped by 5.1% for exports and 6.5% for imports.

Moreover, exported goods volumes declined by 1.9%, contrasting with a 7.5% volume increase in imports.
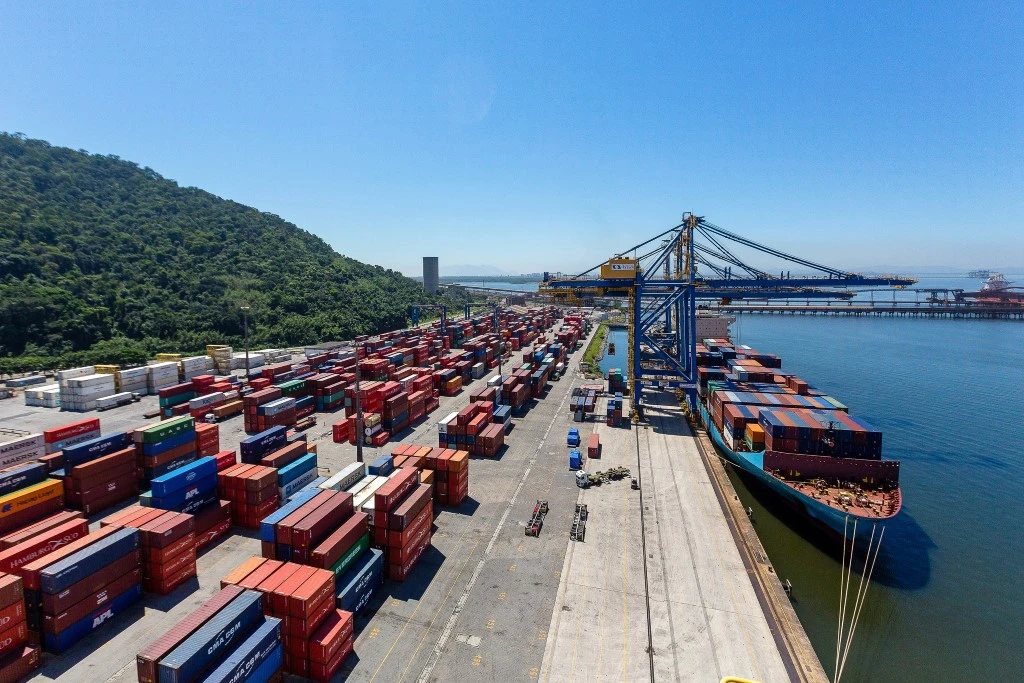
Brazil's Trade Surplus: A Detailed Look at May's Economic Dynamics
Brazil’s Trade Surplus: A Detailed Look at May’s Economic Dynamics. (Photo Internet reproduction)
One-stop reference
Company Intelligence
Every listed company in Latin America — financials, ownership and structure for 1,450+ companies across 26 exchanges, in one place.
Browse the directory →
RT
Ask Rio Times
Latin American markets, currencies and companies.
Open the full Ask Rio Times →

Analyzing the sectors, the extractive industry thrived with a 13.8% increase in exports, primarily fueled by robust petroleum sales.

However, the agricultural sector saw an 18.5% drop in exports, mainly due to faltering soybean sales.

The manufacturing sector also struggled, with a 9.2% reduction in exports, particularly in fuels and soy meal products.

From January to May, Brazil amassed a cumulative trade surplus of $35.887 billion, a 3.9% rise from the same period last year.

The country’s total exports amounted to $138.809 billion against imports of $102.922 billion.

These statistics are crucial, as they illustrate the challenges Brazil faces in its trade strategy amidst volatile global market conditions.

This narrative is essential as it underscores the vital role international trade plays in Brazil’s economy, impacting everything from job creation to exchange rates.

The data highlights both the resilience and vulnerability of various sectors. It offers insights into potential policy adjustments needed to bolster Brazil’s economic stability.

Understanding these dynamics is key for stakeholders navigating the complexities of global trade and economic planning.

This article was produced by The Rio Times’ automated newsroom system. How we use AI · Report an error

LatAm Markets: Live Signals → — real-time movers, turnover leaders and FX across Latin America.

Read More from The Rio Times

The Rio Times · Power Map
See who really holds power in Latin America
Click to open the Power Map

Rotate for Best Experience

This report is optimized for landscape viewing. Rotate your phone for the full experience.