Brazil Markets: Ibovespa & the Real — July 16, 2026
Brazil · Markets
Key Facts
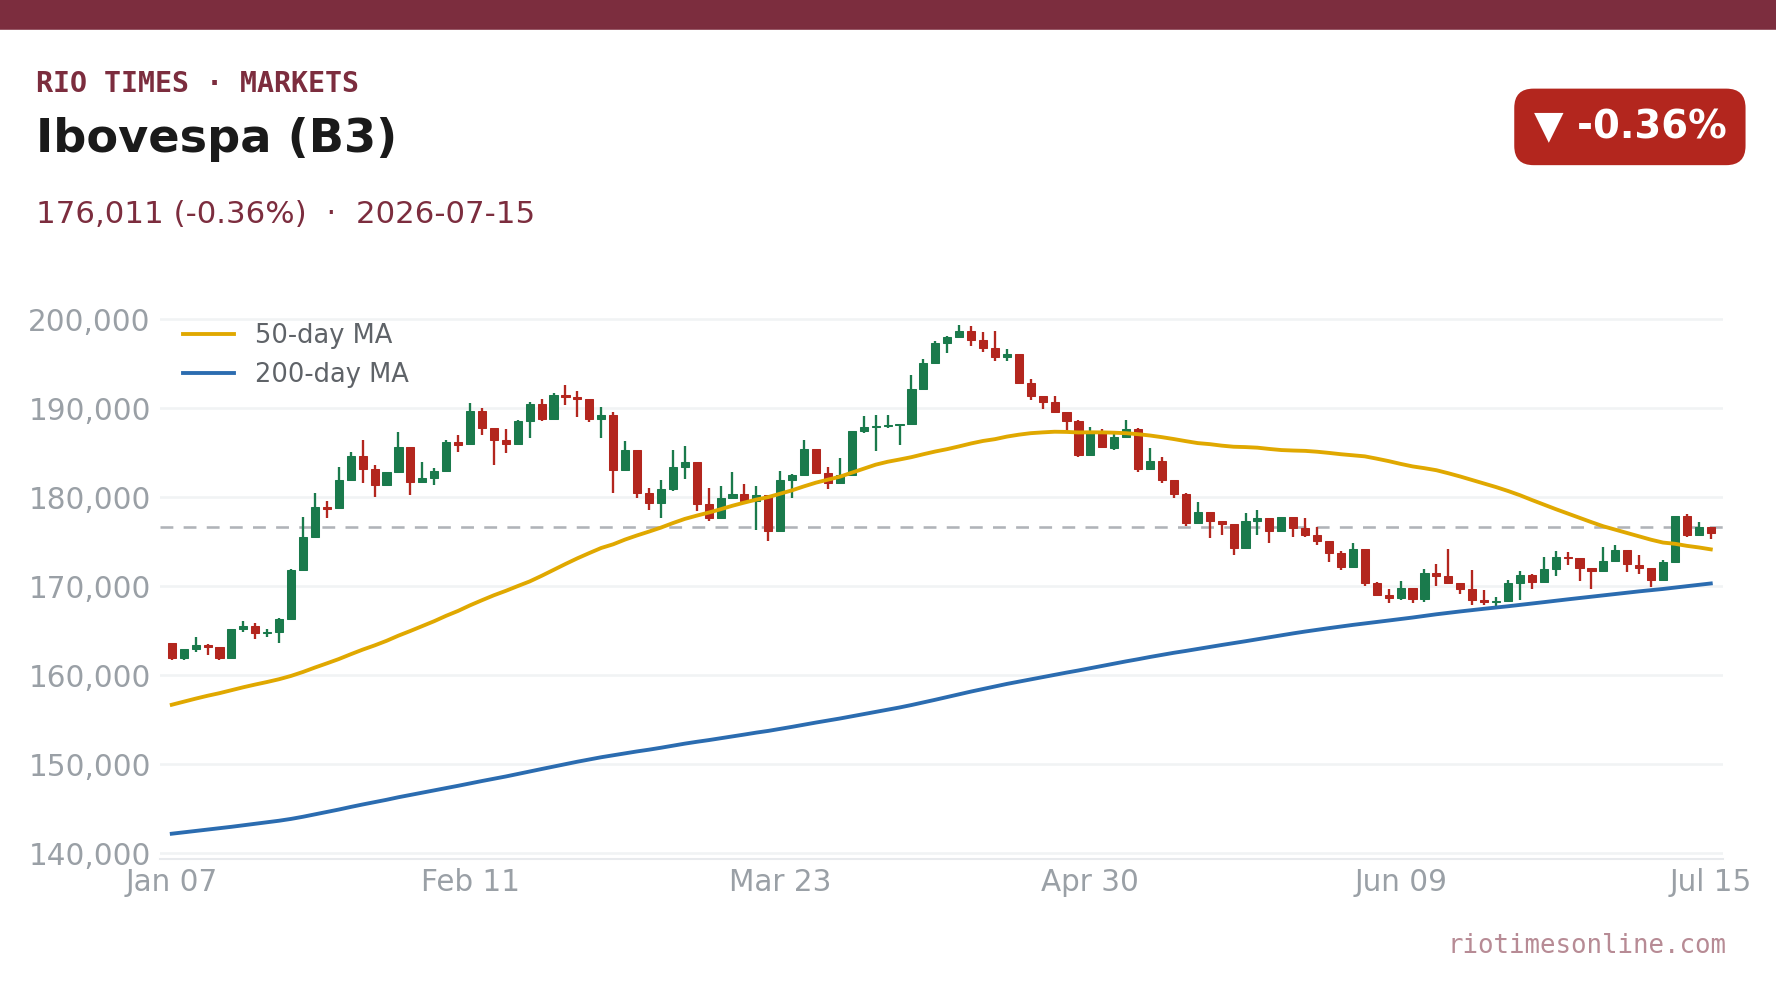
—Ibovespa eased 0.36% to close at 176,011 on Wednesday, a softer session for Brazilian stocks.
—Top gainer: TOTS3 climbed 4.20% to lead the advancers.
—Top decliner: ANIM3 dropped 32.80%, the standout loser.
—Currency: USD/BRL traded at 5.0788, +0.13% on the day.
—Global backdrop: the S&P 500 stood at 7,572 (+0.38%), setting the tone for the region.
The Ibovespa eased 0.36% on Wednesday to close at 176,011, a softer session as decliners outnumbered gainers across Brazilian equities.
The session in one read
Brazil’s benchmark Ibovespa index eased 0.36% to close at 176,011 on Wednesday, leaving it modestly lower after the prior session. Decliners outnumbered gainers on the day, a sign the move reflected company-specific news as much as any market-wide driver. For an internationally minded reader, the headline change is only half the story — the currency does the rest.
TOTS3 was the session’s strongest performer, up 4.20%, while ANIM3 fell 32.80% at the other end of the board. The spread points to a stock-specific session rather than a broad, one-way move.
The day’s gainers
| TOTS3 | +4.20% |
| GGBR4 | +3.80% |
| UGPA3 | +3.30% |
| AMZO34 | +3.20% |
| GOAU4 | +2.80% |
Live Market IntelligenceBrazil — Live Market Board
Rio Times · Live Market Intelligence
Brazil — Live Market Board
+0.54%
205,430.33
+0.54%
68,929.72
+1.87%
10,969.16
-0.02%
2,848,945
-0.35%
2,566.28
-0.55%
60,210.69
-0.91%
| Instrument | Last | Change | YoY | Prev. | High | Low | Volume |
|---|---|---|---|---|---|---|---|
| IBOV | 205,430.33 | +0.54% | +21.85% | 204,324.26 | 168,310 | 167,142 | — |
| USD/BRL | 5.16 | +0.01% | -5.13% | 5.16 | 5.18 | 5.14 | — |
| SELIC | 14.00% | — | — | — | — | — | |
| PETR4 | 41.64 | -0.05% | +35.19% | 41.66 | 41.97 | 41.15 | 41,499,400 |
| VALE3 | 72.97 | +0.83% | +30.75% | 72.37 | 73.54 | 72.66 | 17,658,000 |
| ITUB4 | 38.60 | -1.03% | +4.57% | 39.00 | 39.34 | 38.39 | 29,487,800 |
| BBDC4 | 16.85 | +0.36% | +3.50% | 16.79 | 16.90 | 16.67 | 19,416,900 |
| BBAS3 | 19.37 | +0.47% | +0.73% | 19.28 | 19.44 | 19.16 | 11,069,200 |
| B3SA3 | 14.26 | -0.21% | +12.73% | 14.29 | 14.47 | 14.11 | 33,037,800 |
| ABEV3 | 14.89 | -0.80% | +21.91% | 15.01 | 15.07 | 14.81 | 16,453,100 |
| WEGE3 | 47.59 | +0.49% | +29.99% | 47.36 | 48.08 | 47.36 | 3,364,600 |
| PRIO3 | 59.14 | -0.19% | +50.67% | 59.25 | 59.81 | 58.74 | 3,325,600 |
| SUZB3 | 41.33 | +2.35% | -23.55% | 40.38 | 41.48 | 40.35 | 3,914,900 |
| RENT3 | 34.68 | -0.09% | +0.84% | 34.71 | 34.96 | 34.35 | 7,979,100 |
| AZZA3 | 15.89 | -2.63% | -53.76% | 16.32 | 16.42 | 15.82 | 1,330,300 |
| CSNA3 | 4.30 | +0.47% | -42.65% | 4.28 | 4.41 | 4.26 | 10,076,100 |
| GGBR4 | 24.69 | +2.19% | +51.38% | 24.16 | 24.85 | 24.18 | 7,047,600 |
| ENEV3 | 24.21 | -1.38% | +70.49% | 24.55 | 24.64 | 23.99 | 9,297,000 |
The day’s decliners
| ANIM3 | -32.80% |
| MUTC34 | -8.00% |
| EGIE3 | -5.10% |
| ISAE4 | -5.00% |
| TEND3 | -4.50% |
The day’s numbers
| Instrument | Level | Change |
|---|---|---|
| Ibovespa | 176,011 | -0.36% |
| S&P 500 | 7,572 | +0.38% |
| USD/BRL | 5.0788 | +0.13% |
Why it moved
Gains were paced by TOTS3 (+4.20%), GGBR4 (+3.80%), UGPA3 (+3.30%), while the drag came from ANIM3 (-32.80%), MUTC34 (-8.00%), EGIE3 (-5.10%). Direction for the whole index came as much from the currency and the US tape as from any single local story, with the S&P 500 at 7,572 (+0.38%) framing risk appetite. On a softer day, foreign investors watch whether the move is broad or concentrated before drawing conclusions about the trend.
The currency
USD/BRL changed hands at 5.0788, +0.13% on the day. For foreign residents and investors, the exchange rate is the second half of the return: it decides how much a move in local shares is worth once converted back into dollars. A stronger local unit can turn a flat equity session into a dollar gain, and a weaker one can do the reverse.
The technical picture
The Ibovespa sits about some distance from its 52-week high, inside a 12-month range of 132,129 to 198,657. That keeps the index near the top of its range as traders weigh valuations against the rate and growth outlook.
What to watch next
Investors will track the next US session, commodity prices and local data for direction. The Ibovespa and USD/BRL remain the two gauges to follow for Brazilian markets in the days ahead.
Filed from the markets desk. All figures reflect the Wednesday close (July 15, 2026) from exchange and end-of-day data.
More: Brazil news in English, every day from The Rio Times.
This article was produced by The Rio Times’ automated newsroom system. How we use AI · Report an error · Editorial responsibility: Matthias Camenzind, Editor-in-Chief