IBOV 185,547.66 ▼ 0.51% IPSA 11,235.54 ▼ 0.77% IPC MEX 63,507.11 ▼ 1.11% MERVAL 3,028,871 ▼ 1.65% COLCAP 2,511.76 ▼ 2.16% BVL PERÚ 58,496.57 ▲ 0.80% USD/BRL5.15— 0.00% USD/MXN17.23▼ 0.09% USD/CLP954.20▼ 0.22% USD/COP3,135▲ 0.66% USD/PEN3.37▲ 0.45% USD/ARS1,512▲ 0.37% USD/UYU40.19▲ 2.94% USD/PYG5,905▲ 1.29% USD/BOB10.10▼ 13.67% USD/DOP59.01▲ 0.27% USD/CRC444.45▲ 1.84% USD/GTQ7.62▲ 2.98% USD/HNL26.85▲ 0.27% USD/NIO36.62▲ 2.69% USD/VES845.33▼ 0.13% USD/PAB1.00— 0.00% USD/BZD2.00— 0.00% USD/JMD 157.28 — 0.00% USD/TTD6.73▲ 2.25% EUR/BRL5.90▼ 0.40% BRENT 88.88 ▼ 0.03% WTI 83.11 ▼ 0.11% IRON ORE 161.91 — — COPPER 6.61 ▲ 0.03% GOLD 4,461 ▲ 1.78% SILVER 65.59 ▲ 1.26% SOY 1,184 ▲ 3.20% CORN 480.50 ▲ 10.02% WHEAT 655.00 ▲ 3.93% COFFEE 317.25 ▼ 5.51% SUGAR 16.43 ▼ 1.79% ORANGE JUICE 138.55 ▼ 0.47% COTTON 85.03 ▲ 2.33% COCOA 5,719 ▲ 3.18% BEEF 223.60 ▼ 3.93% CATTLE 339.10 ▼ 3.16% LITHIUM 75.20 ▲ 1.47% PETR4 41.64 ▼ 0.05% VALE3 72.97 ▲ 0.83% ITUB4 38.60 ▼ 1.03% BBDC4 16.85 ▲ 0.36% ABEV3 14.89 ▼ 0.80% BBAS3 19.37 ▲ 0.47% B3SA3 14.26 ▼ 0.21% WEGE3 47.59 ▲ 0.49% PRIO3 59.14 ▼ 0.19% SUZB3 41.33 ▲ 2.35% RENT3 34.68 ▼ 0.09% AZZA3 15.89 ▼ 2.63% CSAN3 3.22 ▼ 1.83% RAIZ4 0.25 — 0.00% PCAR3 2.75 ▼ 0.36% GMAT3 3.65 ▼ 1.08% PSSA3 48.13 ▼ 0.54% CVCB3 1.33 ▼ 2.92% POSI3 3.36 ▲ 2.44% SLCE3 13.34 ▲ 0.30% NATU3 8.14 ▼ 0.73% IBOV 185,547.66 ▼ 0.51% IPSA 11,235.54 ▼ 0.77% IPC MEX 63,507.11 ▼ 1.11% MERVAL 3,028,871 ▼ 1.65% COLCAP 2,511.76 ▼ 2.16% BVL PERÚ 58,496.57 ▲ 0.80% USD/BRL 5.16 ▲ 0.01% USD/MXN 17.06 ▼ 0.24% USD/CLP 913.98 ▲ 0.04% USD/COP 3,140 ▲ 0.03% USD/PEN 3.36 ▼ 0.66% USD/ARS 1,493 ▲ 0.10% USD/UYU 40.27 ▲ 1.24% USD/PYG 5,939 ▲ 1.68% USD/BOB 11.64 ▼ 0.76% USD/DOP 58.34 ▲ 1.25% USD/CRC 445.92 ▲ 0.89% USD/GTQ 7.62 ▲ 2.21% USD/HNL 26.79 ▲ 1.57% USD/NIO 36.62 ▲ 0.69% USD/VES 762.44 ▼ 0.13% USD/PAB 1.00 — 0.00% USD/BZD 2.00 — 0.00% USD/JMD 157.28 — 0.00% USD/TTD 6.70 ▲ 0.61% EUR/BRL 5.95 ▲ 1.01% BRENT 88.88 ▼ 0.03% WTI 83.11 ▼ 0.11% IRON ORE 161.91 — — COPPER 6.61 ▲ 0.03% GOLD 4,461 ▲ 1.78% SILVER 65.59 ▲ 1.26% SOY 1,184 ▲ 3.20% CORN 480.50 ▲ 10.02% WHEAT 655.00 ▲ 3.93% COFFEE 317.25 ▼ 5.51% SUGAR 16.43 ▼ 1.79% ORANGE JUICE 138.55 ▼ 0.47% COTTON 85.03 ▲ 2.33% COCOA 5,719 ▲ 3.18% BEEF 223.60 ▼ 3.93% CATTLE 339.10 ▼ 3.16% LITHIUM 75.20 ▲ 1.47% PETR4 41.64 ▼ 0.05% VALE3 72.97 ▲ 0.83% ITUB4 38.60 ▼ 1.03% BBDC4 16.85 ▲ 0.36% ABEV3 14.89 ▼ 0.80% BBAS3 19.37 ▲ 0.47% B3SA3 14.26 ▼ 0.21% WEGE3 47.59 ▲ 0.49% PRIO3 59.14 ▼ 0.19% SUZB3 41.33 ▲ 2.35% RENT3 34.68 ▼ 0.09% AZZA3 15.89 ▼ 2.63% CSAN3 3.22 ▼ 1.83% RAIZ4 0.25 — 0.00% PCAR3 2.75 ▼ 0.36% GMAT3 3.65 ▼ 1.08% PSSA3 48.13 ▼ 0.54% CVCB3 1.33 ▼ 2.92% POSI3 3.36 ▲ 2.44% SLCE3 13.34 ▲ 0.30% NATU3 8.14 ▼ 0.73%
since 2009
Thursday, September 17, 2026

Agri Business Business - Brazil

USDA Adjusts Corn and Soybean Production Forecasts

By · July 12, 2024 · 2 min read

The LatAm Brief

One email, every weekday morning. What moved in Latin American markets, politics and expat life.

Yesterday’s subject line: “Maduro's money man just pleaded guilty”

Free. We send a confirmation link first — nothing arrives until you click it. Unsubscribe with one click in any edition. If you stop opening us for 30 days we stop sending by ourselves, as we assume the interest is no longer there. See our privacy policy. We never share your email.

On Friday, the USDA revised its crop forecasts. Corn production is up, but soybean numbers are down. This change matches the acres sown for each crop.

Moreover, the USDA cut its final stock estimates for corn and soybeans. Both fell short of what market watchers predicted.

These updates could influence market dynamics, with U.S. growers anticipating robust harvests that push commodity prices down.

By September 2025, the USDA expects corn stockpiles to reach a six-year peak. They forecast the 2024–25 corn output as the third highest ever recorded.

Market reactions were swift. Lower-than-expected stock figures pushed corn and soybean futures up on the Chicago Board of Trade.
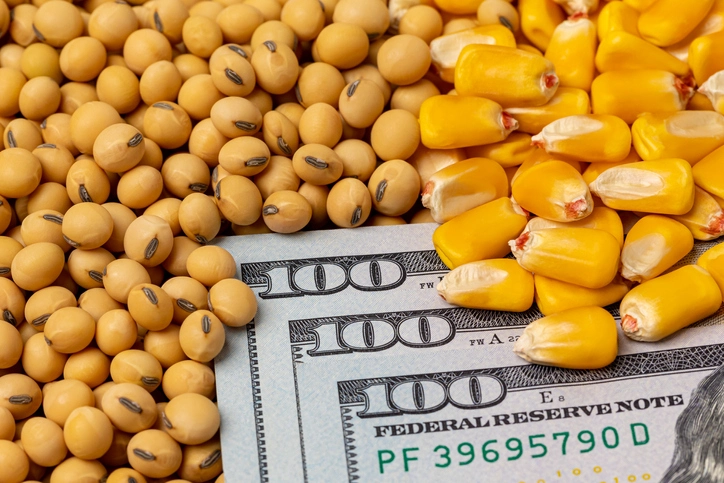
USDA Adjusts Corn and Soybean Production Forecasts
USDA Adjusts Corn and Soybean Production Forecasts.
One-stop reference
Company Intelligence
Every listed company in Latin America — financials, ownership and structure for 1,450+ companies across 26 exchanges, in one place.
Browse the directory →
RT
Ask Rio Times
Latin American markets, currencies and companies.
Open the full Ask Rio Times →

This spike came as a surprise, especially since it contrasted sharply with the prevailing downward trend.

Ted Seifried of Zaner Group pointed out the unusual drop in old crop carryover stocks—much more than anyone anticipated.

It seems the older crop’s final tally stood at 1.877 billion bushels, a dip from both June’s projection and last year’s 2.049 billion bushels.

Investment analysts like Larissa Quaresma from Empiricus Research suggest seizing this moment.

She considers the agricultural sector undervalued, placing such stocks on her preferred list.

Such USDA updates hold broader significance. They guide farmers on what to plant next season and help investors gauge future market trends.

As these numbers ripple through markets, they affect everything from farm strategies in the Midwest to grocery prices nationwide.

Thus, each USDA report, though routine, threads through the fabric of both local and global economies, shaping decisions in boardrooms and on family farms.

This article was produced by The Rio Times’ automated newsroom system. How we use AI · Report an error

Read More from The Rio Times

The Rio Times · Power Map
See who really holds power in Latin America
Click to open the Power Map

Rotate for Best Experience

This report is optimized for landscape viewing. Rotate your phone for the full experience.