
UGANDA · TRADE
Key Facts
- —The country Uganda is a landlocked East African nation whose export earnings now rest mainly on gold, with coffee its leading farm export.
- —Why it matters Spending far more dollars on imports than exports earn can press on the Ugandan shilling and on reserves.
- —What happened August exports were US$1,492.1 million and imports, with freight and insurance, US$2,635.8 million: a Uganda trade deficit of US$1,143.7 million.
- —The numbers July’s gap was US$451.3 million and August 2025’s US$579.8 million; August’s gap is the widest in monthly data going back to 1993.
- —The driver Private imports of mineral products other than petroleum doubled to US$1,160.2 million from US$567.8 million in July.
- —What it means for you Direct US trade is small, but gold and coffee are priced in dollars and a weaker shilling hits foreign holders of Ugandan assets.
- —Still open The central bank’s tables do not say which mineral products came in, or whether the surge will last.
The Uganda trade deficit hit a record US$1,143.7 million in August 2026, tables from the Bank of Uganda, the country’s central bank, show. For US investors, it shows the East African country paying far more dollars for imports than it earns, which can weigh on the shilling.
Imports surged 42% in a single month, leaving a gap more than double July’s US$451.3 million. It is also about twice the US$579.8 million recorded in August 2025.
Imports Jump 42% in One Month
Total imports, valued with freight and insurance, rose to US$2,635.8 million in August from US$1,853.0 million in July. That is the highest monthly import bill in the Bank of Uganda series.
Exports rose as well, to US$1,492.1 million from US$1,401.7 million, led by US$889.0 million of gold. Subtracting imports from exports leaves the Uganda trade deficit at US$1,143.7 million.
The bank’s headline measure values imports before freight and insurance, as in the balance of payments. On that basis the Uganda trade deficit was US$817.0 million, up from US$224.8 million in July and also the widest since 1993.
A year earlier, in August 2025, the deficit stood at US$579.8 million. Imports have grown about 61% since then, while exports grew about 41%.
The figures come from the central bank’s monthly Composition of Exports and Composition of Imports tables. Both now carry data up to August 2026.
Mineral Products Drive the Surge
The bank’s breakdown of formal private imports points to one line above all. Mineral products other than petroleum rose to US$1,160.2 million in August from US$567.8 million in July.
That single category accounts for about 86% of the rise in formal private imports. Those imports climbed to US$2,283.1 million from US$1,590.7 million, measured before freight and insurance.
Petroleum product imports also rose, to US$244.6 million from US$200.7 million. Machinery, equipment and vehicles barely moved, at US$297.2 million against US$286.6 million in July.
Government project imports fell to US$10.9 million from US$24.3 million. The increase therefore came from private importers rather than state projects.
Gold Holds Up Exports as Coffee Slips
Gold exports earned US$889.0 million in August, up from US$788.5 million in July. That is about 60% of all export earnings, from roughly 6,800 kilograms of the metal.
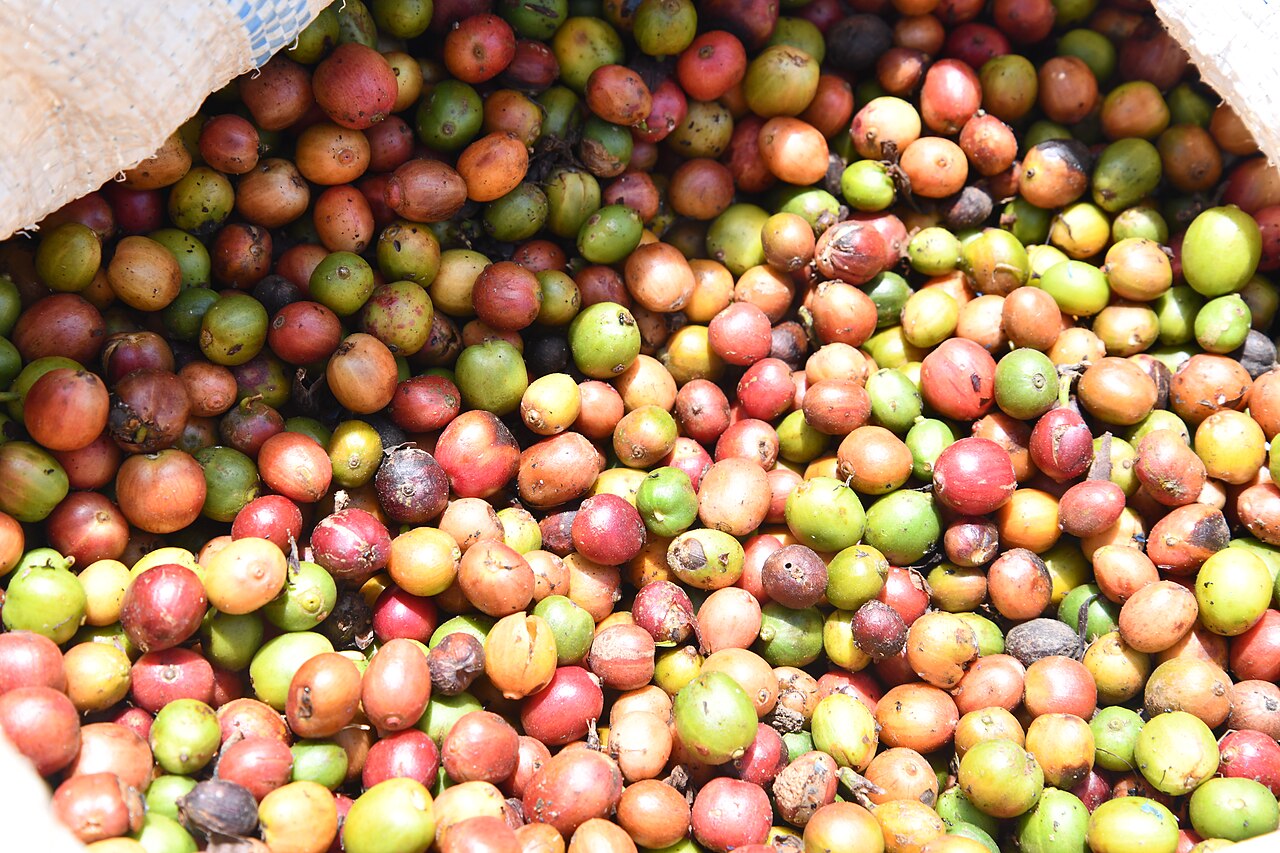
Coffee, Uganda’s largest farm export, fell to US$181.7 million from US$204.1 million. Shipments dropped to about 738,000 bags of 60 kilograms, from about 847,000 in July.
The United Arab Emirates bought US$795.8 million of Ugandan goods in August, more than half of formal exports. The bank’s direction-of-trade table does not split that figure by product.
An earlier analysis of Uganda’s gold trade traces how the metal rose to the top of the export list.
Where the Extra Imports Came From
By origin, imports from Kenya rose to US$714.5 million in August from US$484.3 million in July. These figures exclude freight and insurance.
Imports from African countries the bank lists only as “other” leapt to US$321.0 million from US$0.5 million. Tanzania, Uganda’s southern neighbour, supplied US$203.6 million, up from US$109.7 million.
Asian suppliers moved less. Imports from China rose to US$298.4 million from US$256.4 million, and from India to US$254.3 million from US$226.7 million.
What It Means for US Readers
The Uganda trade deficit has little to do with direct trade with the United States. Uganda shipped US$6.8 million of goods to the US in August and bought US$14.9 million from it, the bank’s tables show.
The bigger link runs through dollar prices. Gold and coffee trade in US dollars, so moves in New York and London markets feed straight into Uganda’s export earnings.
A record goods gap also means heavy demand for dollars in Kampala, the capital. That can weigh on the shilling and on returns for foreign holders of Ugandan government bonds.
Gross foreign-exchange reserves slipped to US$6,519.6 million at the end of August from US$6,616.3 million in July, central bank data show. The shilling weakened to 3,920 per US dollar at the end of September, from about 3,780 a month earlier.
Uganda’s oil plans add another angle for foreign investors. The East African Crude Oil Pipeline is designed to carry Ugandan crude 1,443 kilometres from Hoima to Tanga in Tanzania.
France’s TotalEnergies owns 62% of the project, Uganda’s and Tanzania’s state oil companies 15% each, and China’s state-owned oil company CNOOC 8%. The August tables show no sign that pipeline equipment drove the jump, as machinery imports barely moved.
What Is Not Known
The tables do not say which mineral products Uganda imported in August, or which countries sit behind the “other” African line.
The tables carry no commentary on whether the import surge is a one-off. The September figures will show whether the Uganda trade deficit narrows again.
Nor do the tables show how much of the extra imports will leave the country again as exports in later months.
More: Uganda news in English, every day from The Rio Times.
Frequently Asked Questions
How big was the Uganda trade deficit in August 2026?
Bank of Uganda tables put the Uganda trade deficit at US$1,143.7 million, with exports of US$1,492.1 million and imports of US$2,635.8 million. It is the widest monthly gap since the series began in 1993.
Why did Uganda’s imports jump so much?
Private imports of mineral products other than petroleum doubled to US$1,160.2 million. That category explains about 86% of the rise in formal private imports, while machinery and fuel moved far less.
Is gold still Uganda’s biggest export?
Yes. Gold earned US$889.0 million in August, about 60% of all exports. Coffee, the largest farm export, brought in US$181.7 million.
Does the Uganda trade deficit matter to Americans?
Direct trade is small, at US$6.8 million of exports to the US and US$14.9 million of imports in August. The main links are dollar-priced gold and coffee and the value of the shilling.
Did the oil pipeline project cause the jump?
The bank’s tables do not tie the increase to oil projects. Machinery imports barely moved, and government project imports fell to US$10.9 million.
Sources: Bank of Uganda, Composition of Exports (values and volumes, to August 2026), 5 October 2026; Bank of Uganda, Composition of Imports (values and volume indices, to August 2026), 5 October 2026; Bank of Uganda, Selected Macroeconomic Indicators (monthly, to September 2026), 5 October 2026; Bank of Uganda, Direction of Trade: Exports, August 2026 data; Bank of Uganda, Direction of Trade: Imports, August 2026 data; EACOP, project overview, accessed 7 October 2026.
This article was produced by The Rio Times’ automated newsroom system. How we use AI · Report an error · Editorial responsibility: Matthias Camenzind, Editor-in-Chief