IBOV 204,787.81 ▲ 0.23% IPSA 11,010.12 ▲ 0.35% IPC MEX 67,663.29 ▲ 1.31% MERVAL 2,860,760 ▲ 0.06% COLCAP 2,574.78 ▼ 0.22% BVL PERÚ 60,210.69 ▲ 0.10% USD/BRL5.08▼ 0.34% USD/MXN18.48▲ 0.35% USD/CLP984.01▲ 0.28% USD/COP3,175▼ 0.64% USD/PEN3.43▼ 0.23% USD/ARS1,513— 0.00% USD/UYU40.13▲ 3.08% USD/PYG5,686▲ 3.07% USD/BOB11.61▲ 2.27% USD/DOP61.26▲ 0.43% USD/CRC448.47▲ 1.59% USD/GTQ7.65▲ 3.30% USD/HNL26.86▲ 0.34% USD/NIO36.62▼ 0.07% USD/VES877.92▼ 0.13% USD/PAB1.00— 0.00% USD/BZD2.00— 0.00% USD/JMD 157.28 — 0.00% USD/TTD6.73▲ 2.13% EUR/BRL5.70▲ 1.08% BRENT 88.88 ▼ 0.03% WTI 83.11 ▼ 0.11% IRON ORE 161.91 — — COPPER 6.61 ▲ 0.03% GOLD 4,461 ▲ 1.78% SILVER 65.59 ▲ 1.26% SOY 1,184 ▲ 3.20% CORN 480.50 ▲ 10.02% WHEAT 655.00 ▲ 3.93% COFFEE 317.25 ▼ 5.51% SUGAR 16.43 ▼ 1.79% ORANGE JUICE 138.55 ▼ 0.47% COTTON 85.03 ▲ 2.33% COCOA 5,719 ▲ 3.18% BEEF 223.60 ▼ 3.93% CATTLE 339.10 ▼ 3.16% LITHIUM 75.20 ▲ 1.47% PETR4 41.64 ▼ 0.05% VALE3 72.97 ▲ 0.83% ITUB4 38.60 ▼ 1.03% BBDC4 16.85 ▲ 0.36% ABEV3 14.89 ▼ 0.80% BBAS3 19.37 ▲ 0.47% B3SA3 14.26 ▼ 0.21% WEGE3 47.59 ▲ 0.49% PRIO3 59.14 ▼ 0.19% SUZB3 41.33 ▲ 2.35% RENT3 34.68 ▼ 0.09% AZZA3 15.89 ▼ 2.63% CSAN3 3.22 ▼ 1.83% RAIZ4 0.25 — 0.00% PCAR3 2.75 ▼ 0.36% GMAT3 3.65 ▼ 1.08% PSSA3 48.13 ▼ 0.54% CVCB3 1.33 ▼ 2.92% POSI3 3.36 ▲ 2.44% SLCE3 13.34 ▲ 0.30% NATU3 8.14 ▼ 0.73% IBOV 204,787.81 ▲ 0.23% IPSA 11,010.12 ▲ 0.35% IPC MEX 67,663.29 ▲ 1.31% MERVAL 2,860,760 ▲ 0.06% COLCAP 2,574.78 ▼ 0.22% BVL PERÚ 60,210.69 ▲ 0.10% USD/BRL 5.16 ▲ 0.01% USD/MXN 17.06 ▼ 0.24% USD/CLP 913.98 ▲ 0.04% USD/COP 3,140 ▲ 0.03% USD/PEN 3.36 ▼ 0.66% USD/ARS 1,493 ▲ 0.10% USD/UYU 40.27 ▲ 1.24% USD/PYG 5,939 ▲ 1.68% USD/BOB 11.64 ▼ 0.76% USD/DOP 58.34 ▲ 1.25% USD/CRC 445.92 ▲ 0.89% USD/GTQ 7.62 ▲ 2.21% USD/HNL 26.79 ▲ 1.57% USD/NIO 36.62 ▲ 0.69% USD/VES 762.44 ▼ 0.13% USD/PAB 1.00 — 0.00% USD/BZD 2.00 — 0.00% USD/JMD 157.28 — 0.00% USD/TTD 6.70 ▲ 0.61% EUR/BRL 5.95 ▲ 1.01% BRENT 88.88 ▼ 0.03% WTI 83.11 ▼ 0.11% IRON ORE 161.91 — — COPPER 6.61 ▲ 0.03% GOLD 4,461 ▲ 1.78% SILVER 65.59 ▲ 1.26% SOY 1,184 ▲ 3.20% CORN 480.50 ▲ 10.02% WHEAT 655.00 ▲ 3.93% COFFEE 317.25 ▼ 5.51% SUGAR 16.43 ▼ 1.79% ORANGE JUICE 138.55 ▼ 0.47% COTTON 85.03 ▲ 2.33% COCOA 5,719 ▲ 3.18% BEEF 223.60 ▼ 3.93% CATTLE 339.10 ▼ 3.16% LITHIUM 75.20 ▲ 1.47% PETR4 41.64 ▼ 0.05% VALE3 72.97 ▲ 0.83% ITUB4 38.60 ▼ 1.03% BBDC4 16.85 ▲ 0.36% ABEV3 14.89 ▼ 0.80% BBAS3 19.37 ▲ 0.47% B3SA3 14.26 ▼ 0.21% WEGE3 47.59 ▲ 0.49% PRIO3 59.14 ▼ 0.19% SUZB3 41.33 ▲ 2.35% RENT3 34.68 ▼ 0.09% AZZA3 15.89 ▼ 2.63% CSAN3 3.22 ▼ 1.83% RAIZ4 0.25 — 0.00% PCAR3 2.75 ▼ 0.36% GMAT3 3.65 ▼ 1.08% PSSA3 48.13 ▼ 0.54% CVCB3 1.33 ▼ 2.92% POSI3 3.36 ▲ 2.44% SLCE3 13.34 ▲ 0.30% NATU3 8.14 ▼ 0.73%
since 2009
Friday, October 16, 2026

North America World-News

U.S. Construction Spending Falls in January as Manufacturing PMI Signals Modest Growth

By · March 3, 2025 · 2 min read

The U.S. construction sector experienced an unexpected decline in January 2025, with spending falling 0.2% from December, according to the Commerce Department.

This drop brought the annualized spending rate to $2.193 trillion (R$13.16 trillion), down from December’s revised $2.196 trillion (R$13.18 trillion). The decline surprised analysts, who had expected no change, despite a 3.3% year-over-year increase in construction expenditures.

Private construction spending fell by 0.2%, driven by a 0.4% decline in residential investment, which reached an annualized $932.7 billion (R$5.60 trillion). Multi-family housing projects dropped 0.7%, reflecting weaker demand, while single-family home construction rose by 0.6%.

Elevated mortgage rates remain a major headwind for residential construction, compounded by an oversupply of unsold homes and potential new tariffs on imported lumber and other materials.

Public construction spending provided some stability, rising 0.1% to an annualized $506.6 billion (R$3.04 trillion). Federal government projects surged by 3.2%, offsetting a 0.1% decline in state and local government expenditures.
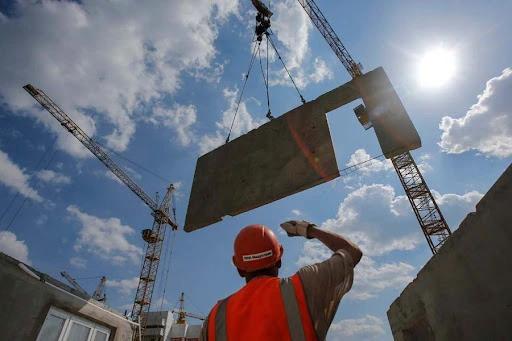
U.S. Construction Spending Falls in January as Manufacturing PMI Signals Modest Growth
U.S. Construction Spending Falls in January as Manufacturing PMI Signals Modest Growth.
RT
Ask Rio Times
17 years of Latin America reporting, on demand.
Open the full Ask Rio Times →

Highway construction rose by 0.6%, reaching $145 billion (R$870 billion), while educational facility investments fell by 0.4%. Non-residential private construction remained flat at $753.3 billion (R$4.52 trillion), signaling stagnation in sectors like office buildings and factories.

The LatAm Brief

One email, every weekday morning. What moved in Latin American markets, politics and expat life.

Yesterday’s subject line: “IMF sees Brazil as 8th-largest economy by 2027”

Free. We send a confirmation link first — nothing arrives until you click it. Unsubscribe with one click in any edition. If you stop opening us for 30 days we stop sending by ourselves, as we assume the interest is no longer there. See our privacy policy. We never share your email.

U.S. Manufacturing Sees Modest Growth

Meanwhile, the U.S. manufacturing sector showed signs of modest growth in February, as the S&P Global Manufacturing PMI rose to 52.7 from January’s 51.2, marking its highest level since mid-2024. The ISM Manufacturing PMI registered slightly lower at 50.3, down from January’s 50.9 but still indicating expansion after months of contraction.

Factory output grew at its fastest pace in nearly a year, supported by easing supply chain pressures and stabilizing input inventories. However, new orders slowed sharply, with the ISM New Orders Index falling to 48.6 from January’s 55.1, signaling weaker demand ahead.

Higher input costs remain a concern for both sectors, as rising commodity prices and looming tariffs on materials like lumber and steel threaten profitability and project feasibility.

The contrasting trends highlight the mixed economic signals in early 2025: while manufacturing shows gradual recovery, construction faces persistent challenges from high borrowing costs and trade uncertainties that could weigh on broader economic growth in the months ahead.

This article was produced by The Rio Times’ automated newsroom system. How we use AI · Report an error · Editorial responsibility: Matthias Camenzind, Editor-in-Chief

The Rio Times · Power Map
See who really holds power in Latin America
Click to open the Power Map →

Rotate for Best Experience

This report is optimized for landscape viewing. Rotate your phone for the full experience.