Lithium Wrap: LIT Rises 0.27% as China Benchmark Dips

Key Facts
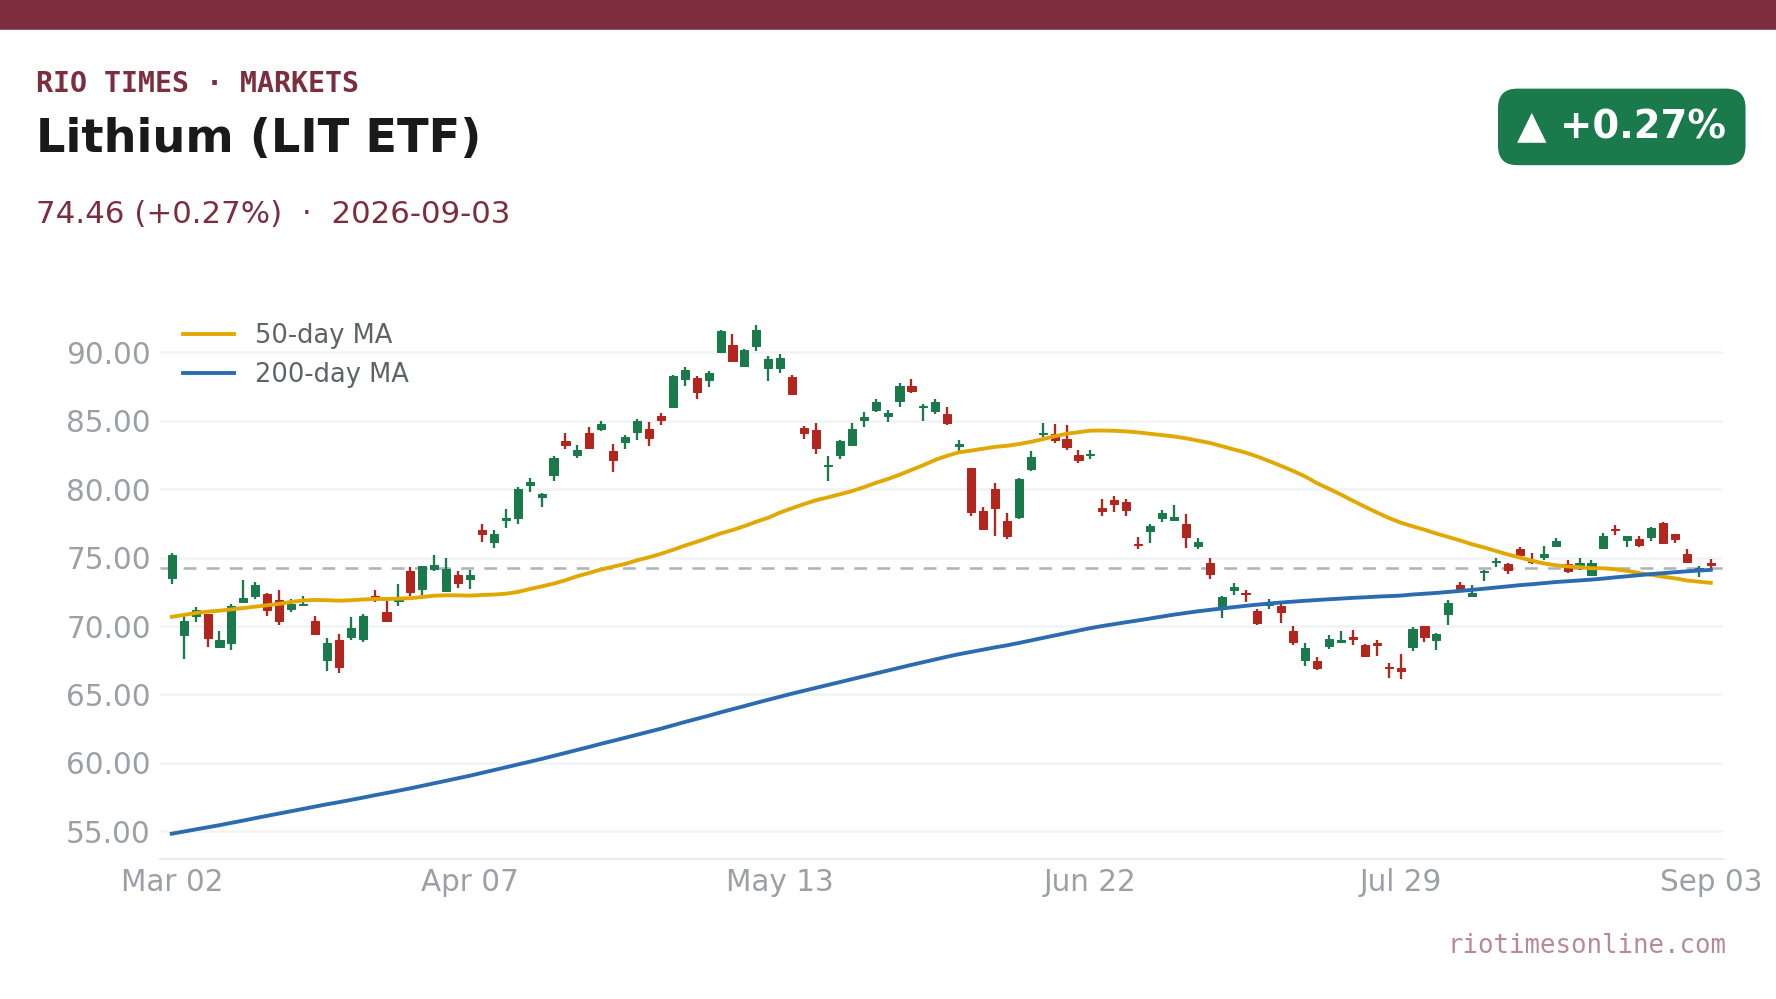
- LIT ETF rose 0.27% to US$74.46 on Thursday, September 3, 2026, a gain of US$0.20 from its prior close of US$74.26.
- Albemarle fell 4.06% to US$132.16, the sharpest drop among the major lithium names on the session.
- SQM lost 1.68% to US$79.78, underperforming the broader lithium-miners ETF.
- Chinese lithium benchmark eased 0.32% to 156,000 CNY per tonne (about US$20,496), down 500 CNY on the day.
- Battery-grade lithium carbonate averaged US$20,496.34 per tonne down US$60.81, according to the Shanghai Metals Market reference.
- Battery storage momentum is supporting miner sentiment as investors weigh grid-scale demand growth against soft Chinese contract prices.
Today’s Focus
The Global X Lithium & Battery Tech ETF, known as LIT, closed at US$74.46, up 0.27% on Thursday, September 3, 2026. Two of its biggest lithium producers fell even as the fund advanced.
Albemarle dropped 4.06% to US$132.16, and Chile’s SQM lost 1.68% to US$79.78.
That divergence matters because the ETF holds a broader mix of miners and battery-technology companies. Single-stock moves reflected company-specific pressure, not a lithium demand collapse.
The physical market was soft but not dramatic: the Chinese lithium benchmark slipped 0.32% to 156,000 CNY per tonne (about US$20,496).
Battery-grade lithium carbonate averaged US$20,496.34 per tonne, down US$60.81, while battery-grade lithium hydroxide fell US$143.02 to an index price of US$18,927.19 per tonne. Regional CIF quotes for China, Japan and South Korea held in familiar ranges, signalling steady trade rather than panic.
For Latin America watchers, the session reinforced a familiar pattern: equities can diverge from the commodity benchmark when individual corporate stories or profit-taking dominate. The broader battery-storage theme continues to give miners a tailwind, but Thursday’s price action showed that support is uneven.
What matters today. The LIT ETF is holding up better than major producer shares. Diversified battery exposure looks more resilient right now than direct bets on Albemarle or SQM.
01 The session in one read
Lithium equities finished Thursday, September 3, 2026, with a split personality. The Global X Lithium & Battery Tech ETF, which tracks miners and battery-technology companies rather than spot lithium, added 0.27% to close at US$74.46.
But the two Western Hemisphere heavyweights went the other way. Albemarle, one of the world’s largest lithium producers, fell 4.06% to US$132.16, while Chile’s SQM shed 1.68% to US$79.78.
LIT’s 0.27% gain against Albemarle’s 4.06% drop and SQM’s 1.68% decline points to stock-specific selling rather than a sector-wide lithium rout. With the Chinese benchmark down only 0.32% and battery-storage demand still rising, the commodity backdrop is not collapsing. The variable to watch is whether Albemarle and SQM can regain ground in the next session. If not, this could mark the start of a broader rotation out of pure-play producers.
02 The board
LIT’s gain of US$0.20 from its previous close of US$74.26 was modest but positive. The fund traded between US$74.00 and US$74.90 during the session.
Volume was around 897,500 shares, suggesting active but not frantic interest.
The physical side was down a touch. The Chinese lithium benchmark settled at 156,000 CNY per tonne (about US$20,496), off 500 CNY or 0.32%.
Battery-grade lithium carbonate averaged US$20,496.34 per tonne, a decline of US$60.81.
| Asset | Level | Change |
|---|---|---|
| Lithium (LIT ETF) | US$74.46 | +0.27% |
| Albemarle | US$132.16 | -4.06% |
| SQM | US$79.78 | -1.68% |
Source: RT close, 2026-09-03. Where a commodity has no spot feed, an exchange-traded tracker or leading producer is shown as a labelled proxy.
Live Market IntelligenceThe live market board
Rio Times · Live Market Intelligence
Latin America — Cross-Market Board
| Instrument | Last | Change | YoY | Prev. | High | Low | Volume |
|---|---|---|---|---|---|---|---|
| IBOV | 205,430.33 | +0.54% | +21.85% | 204,324.26 | 168,310 | 167,142 | — |
| IPSA | 11,013.03 | +0.39% | — | 10,970.29 | 11,210 | 10,984 | 1,513,213,483 |
| IPC MEX | 68,929.72 | +1.87% | +12.17% | 67,663.29 | 66,121 | 65,405 | 108,886,187 |
| MERVAL | 2,848,945 | -0.35% | +30.51% | 3,022,485 | 3,042,365 | 2,991,150 | — |
| COLCAP | 2,566.28 | -0.55% | — | 9.04 | 9.05 | 9.02 | 4,133 |
| BVL PERÚ | 60,210.69 | -0.91% | — | — | — | — | — |
| USD/BRL | 5.16 | +0.01% | -5.13% | 5.16 | 5.18 | 5.14 | — |
| EUR/BRL | 5.95 | +1.01% | -5.83% | 5.89 | 5.98 | 5.94 | — |
| USD/MXN | 17.06 | -0.24% | -8.58% | 17.10 | 17.08 | 17.01 | — |
| USD/CLP | 913.98 | +0.04% | -5.67% | 913.65 | 915.11 | 906.68 | — |
| USD/COP | 3,140 | +0.03% | -22.04% | 3,139 | 3,141 | 3,105 | — |
| USD/PEN | 3.36 | -0.66% | -4.82% | 3.38 | 3.38 | 3.35 | — |
| USD/ARS | 1,493 | +0.10% | +12.96% | 1,491 | 1,494 | 1,480 | — |
| USD/UYU | 40.27 | +1.24% | +1.80% | 39.77 | 40.27 | 40.23 | — |
| USD/PYG | 5,939 | +1.68% | -19.54% | 5,841 | 5,939 | 5,925 | — |
| USD/BOB | 11.64 | -0.76% | +72.04% | 11.73 | 11.72 | 11.64 | — |
| USD/DOP | 58.34 | +1.25% | -3.44% | 57.62 | 58.34 | 58.04 | — |
| USD/CRC | 445.92 | +0.89% | -9.71% | 441.97 | 448.50 | 445.92 | — |
Live Company IntelligenceSociedad Quimica y Minera de Chile SA ADR B — the full investor dossier
Wall Street view
Valuation & profitability
Price & risk
$41.1452-wk high
$96.14
Revenue trend · 6y
Ownership
Dividend
03 What moved it
The session’s main driver was the tension between soft Chinese contract prices and durable battery-storage demand. Industrial-grade lithium carbonate slipped US$60.97 to average US$19,839.41 per tonne, and battery-grade lithium hydroxide fell US$143.02 to US$18,927.19 per tonne.
Albemarle’s 4.06% drop, far steeper than the commodity itself, hints at company-specific selling or profit-taking after a strong run. SQM’s 1.68% decline also outran the physical market’s 0.32% slide.
That gap suggests some investors were trimming producer exposure even as the diversified ETF held firm.
04 The Latin American read
For the Lithium Triangle of Chile, Argentina and Bolivia, the message is nuanced. Foreign investors are not abandoning the battery theme, but they are becoming choosier.
LIT’s resilience shows appetite for diversified exposure across miners and battery technology, avoiding single-country or single-company risk.
SQM’s loss is notable because Chile has been positioning itself as the most stable jurisdiction in the region. A 1.68% decline in New York-traded shares came on a day when the ETF rose.
That gap suggests the market is separating a mildly weaker commodity from a possibly overbought stock.
05 The names to watch
LIT remains the cleanest vehicle for foreigners who want lithium exposure without betting on a single producer. Its close at US$74.46 shows it is still within sight of the session high of US$74.90, a sign of underlying demand.
Albemarle’s US$132.16 close and SQM’s US$79.78 close will be tested in the next session. If these two recover while LIT holds, it would confirm the falls were stock-specific.
If they slide again on a flat commodity tape, it could signal a deeper rotation away from pure-play producers.
06 The outlook
The lithium complex enters Friday with a stable-to-slightly-soft commodity backdrop and mixed equity signals. Battery storage projects continue to add long-term demand, but Chinese contract prices have not yet found a clear floor.
For investors, the key is whether the gap between the diversified ETF and the producer shares narrows or widens. A narrowing gap would suggest the producer sell-off was just noise.
A widening one would point to deeper unease about company valuations, even as the sector theme survives.
07 What to watch
- Chinese lithium benchmark: Whether the 0.32% dip extends into a larger move will set the tone for LIT and producer shares.
- Albemarle recovery: A bounce back from US$132.16 would suggest the 4.06% drop was profit-taking rather than a fundamental shift.
- Battery storage project announcements: Grid-scale deployments are a key driver of long-term demand and can offset soft Chinese spot prices.
- SQM trading volume: If SQM’s New York shares see heavy volume near US$79.78, it may indicate institutional repositioning in Chile’s lithium champion.
Frequently Asked Questions
What is LIT?
LIT is an exchange-traded fund that tracks a basket of lithium miners and battery-technology companies, not the raw commodity itself.
Why did Albemarle fall while LIT rose?
Albemarle is a single producer. Company-specific selling or profit-taking can hit it harder than a diversified fund that also holds battery-technology names.
How is lithium priced in China?
The Chinese benchmark closed at 156,000 CNY per tonne (about US$20,496) on Thursday, down 500 CNY or 0.32% from the prior session.
What does the Lithium Triangle mean for investors?
Chile, Argentina and Bolivia hold much of the world’s lithium. Investors often prefer diversified exposure or stable jurisdictions like Chile over single-country equity bets.
Market data: RT
This article was produced by The Rio Times’ automated newsroom system. How we use AI · Report an error · Editorial responsibility: Matthias Camenzind, Editor-in-Chief
LatAm Markets: Live Signals → — real-time movers, turnover leaders and FX across Latin America.