IBOV 175,664.62 ▲ 0.30% IPSA 11,445.90 ▼ 0.22% IPC MEX 65,484.32 ▼ 0.53% MERVAL 2,979,472 ▼ 0.72% COLCAP 2,457.87 ▼ 1.28% BVL PERÚ 60,779.49 ▼ 1.40% USD/BRL5.19▼ 0.16% USD/MXN17.03▼ 0.04% USD/CLP930.58— 0.00% USD/COP3,202▲ 1.26% USD/PEN3.35▼ 0.07% USD/ARS1,512▼ 0.03% USD/UYU40.27▲ 1.47% USD/PYG5,900▲ 1.27% USD/BOB11.78▲ 3.30% USD/DOP58.61▲ 0.96% USD/CRC446.65▲ 0.97% USD/GTQ7.62▲ 2.20% USD/HNL26.84▲ 0.40% USD/NIO36.62— 0.00% USD/VES793.00▼ 0.13% USD/PAB1.00— 0.00% USD/BZD2.00— 0.00% USD/JMD 157.28 — 0.00% USD/TTD6.72▲ 0.84% EUR/BRL6.01▼ 0.07% BRENT 88.88 ▼ 0.03% WTI 83.11 ▼ 0.11% IRON ORE 161.91 — — COPPER 6.61 ▲ 0.03% GOLD 4,461 ▲ 1.78% SILVER 65.59 ▲ 1.26% SOY 1,184 ▲ 3.20% CORN 480.50 ▲ 10.02% WHEAT 655.00 ▲ 3.93% COFFEE 317.25 ▼ 5.51% SUGAR 16.43 ▼ 1.79% ORANGE JUICE 138.55 ▼ 0.47% COTTON 85.03 ▲ 2.33% COCOA 5,719 ▲ 3.18% BEEF 223.60 ▼ 3.93% CATTLE 339.10 ▼ 3.16% LITHIUM 75.20 ▲ 1.47% PETR4 41.64 ▼ 0.05% VALE3 72.97 ▲ 0.83% ITUB4 38.60 ▼ 1.03% BBDC4 16.85 ▲ 0.36% ABEV3 14.89 ▼ 0.80% BBAS3 19.37 ▲ 0.47% B3SA3 14.26 ▼ 0.21% WEGE3 47.59 ▲ 0.49% PRIO3 59.14 ▼ 0.19% SUZB3 41.33 ▲ 2.35% RENT3 34.68 ▼ 0.09% AZZA3 15.89 ▼ 2.63% CSAN3 3.22 ▼ 1.83% RAIZ4 0.25 — 0.00% PCAR3 2.75 ▼ 0.36% GMAT3 3.65 ▼ 1.08% PSSA3 48.13 ▼ 0.54% CVCB3 1.33 ▼ 2.92% POSI3 3.36 ▲ 2.44% SLCE3 13.34 ▲ 0.30% NATU3 8.14 ▼ 0.73% IBOV 175,664.62 ▲ 0.30% IPSA 11,445.90 ▼ 0.22% IPC MEX 65,484.32 ▼ 0.53% MERVAL 2,979,472 ▼ 0.72% COLCAP 2,457.87 ▼ 1.28% BVL PERÚ 60,779.49 ▼ 1.40% USD/BRL 5.16 ▲ 0.01% USD/MXN 17.06 ▼ 0.24% USD/CLP 913.98 ▲ 0.04% USD/COP 3,140 ▲ 0.03% USD/PEN 3.36 ▼ 0.66% USD/ARS 1,493 ▲ 0.10% USD/UYU 40.27 ▲ 1.24% USD/PYG 5,939 ▲ 1.68% USD/BOB 11.64 ▼ 0.76% USD/DOP 58.34 ▲ 1.25% USD/CRC 445.92 ▲ 0.89% USD/GTQ 7.62 ▲ 2.21% USD/HNL 26.79 ▲ 1.57% USD/NIO 36.62 ▲ 0.69% USD/VES 762.44 ▼ 0.13% USD/PAB 1.00 — 0.00% USD/BZD 2.00 — 0.00% USD/JMD 157.28 — 0.00% USD/TTD 6.70 ▲ 0.61% EUR/BRL 5.95 ▲ 1.01% BRENT 88.88 ▼ 0.03% WTI 83.11 ▼ 0.11% IRON ORE 161.91 — — COPPER 6.61 ▲ 0.03% GOLD 4,461 ▲ 1.78% SILVER 65.59 ▲ 1.26% SOY 1,184 ▲ 3.20% CORN 480.50 ▲ 10.02% WHEAT 655.00 ▲ 3.93% COFFEE 317.25 ▼ 5.51% SUGAR 16.43 ▼ 1.79% ORANGE JUICE 138.55 ▼ 0.47% COTTON 85.03 ▲ 2.33% COCOA 5,719 ▲ 3.18% BEEF 223.60 ▼ 3.93% CATTLE 339.10 ▼ 3.16% LITHIUM 75.20 ▲ 1.47% PETR4 41.64 ▼ 0.05% VALE3 72.97 ▲ 0.83% ITUB4 38.60 ▼ 1.03% BBDC4 16.85 ▲ 0.36% ABEV3 14.89 ▼ 0.80% BBAS3 19.37 ▲ 0.47% B3SA3 14.26 ▼ 0.21% WEGE3 47.59 ▲ 0.49% PRIO3 59.14 ▼ 0.19% SUZB3 41.33 ▲ 2.35% RENT3 34.68 ▼ 0.09% AZZA3 15.89 ▼ 2.63% CSAN3 3.22 ▼ 1.83% RAIZ4 0.25 — 0.00% PCAR3 2.75 ▼ 0.36% GMAT3 3.65 ▼ 1.08% PSSA3 48.13 ▼ 0.54% CVCB3 1.33 ▼ 2.92% POSI3 3.36 ▲ 2.44% SLCE3 13.34 ▲ 0.30% NATU3 8.14 ▼ 0.73%
since 2009
Sunday, August 30, 2026

Brazil Politics - Brazil

Latin American Wealth Shrinks Sharply as Global Fortunes Grow

By · June 5, 2025 · 2 min read

Daily Brief

The morning intel from across Latin America. Free.

By subscribing you agree to our privacy policy. We never share your email.

Latin America’s wealthy class is shrinking while other continents see gains. The Capgemini World Wealth Report 2025 shows Latin America lost 8.5% of its high-net-worth individuals (HNWIs) in 2024, with Brazil’s millionaire population dropping 13.3% and Mexico’s falling 13.5%.

In contrast, North America’s HNWI population grew by 7.3%, adding 562,000 new millionaires and reaching 7.9 million, the highest in the world. Asia-Pacific saw a 2.7% increase, while Europe and the Middle East each declined by 2.1%.

Africa and Australasia both recorded positive growth, at 4.7% and 3.9% respectively. Over the past decade, the United States has led global wealth creation, with its millionaire population growing by 78% and now accounting for 37% of the world’s millionaires.

China’s millionaire count rose by 74% in the same period. Meanwhile, Latin America and Africa saw zero net growth in millionaire numbers from 2016 to 2023, remaining at about 600,000 and 200,000 respectively, while North America added 2.7 million millionaires and the Middle East increased by 50%.

Currency depreciation has hit Latin America especially hard. In 2024, the Brazilian real fell 21.6% and the Mexican peso declined 2% against the U.S. dollar, while the dollar itself gained 6.7% globally.
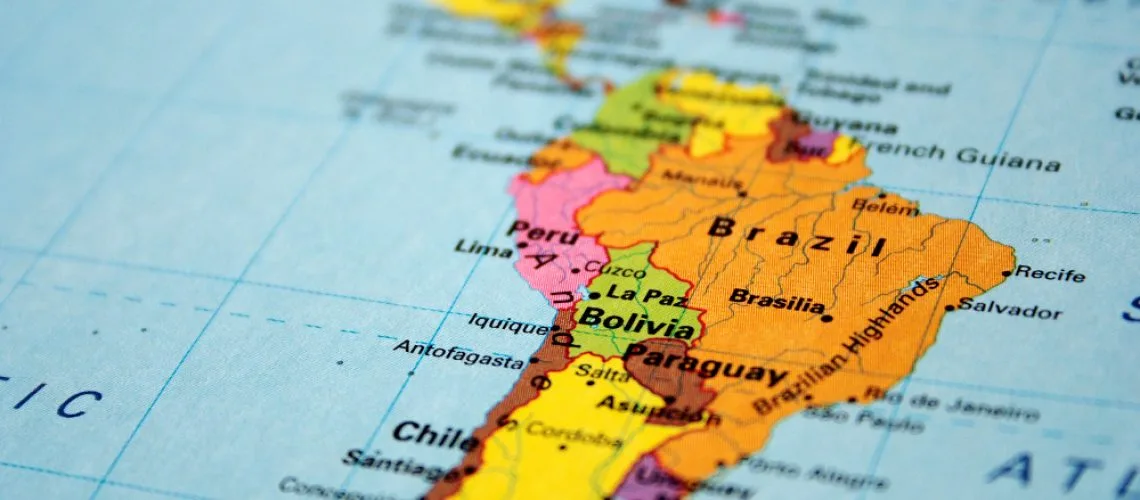
Latin American Wealth Shrinks Sharply as Global Fortunes Grow
Latin American Wealth Shrinks Sharply as Global Fortunes Grow. (Photo Internet reproduction)
One-stop reference
Company Intelligence
Every listed company in Latin America — financials, ownership and structure for 1,450+ companies across 26 exchanges, in one place.
Browse the directory →
RT
Ask Rio Times
This story and the bigger picture.
Open the full Ask Rio Times →

This currency weakness reduced the dollar value of local assets and discouraged investment. Latin American equities were the world’s worst performers in 2024, with the MSCI Latin America index dropping 12.3%, while U.S. equities rose 19.1%, Asia-Pacific 12.1%, and Europe 12.4%.

Inequality in Latin America remains among the highest globally. In Brazil, Chile, Peru, Colombia, and Mexico, the richest 10% capture 60% of national income.

Latin America’s Wealth Inequality and Trade Imbalance

The share of wealth held by the top 1% in these countries is around 40%, far higher than in Europe, where it ranges from 20% to 30%. The region’s wealth-to-income ratios are still well below those of high-income countries, where total wealth is five to seven times annual income.

Trade performance in Latin America has been mixed. After a 1.6% decline in exports in 2023, the region saw a 4.1% rebound in 2024, driven by agricultural recoveries in countries like Uruguay and Argentina.

However, Mexico’s real export growth was only 0.9%. The region’s GDP growth is projected to slow to 1.6% in 2024, compared to global growth of 2.4%. By comparison, the Caribbean is expected to grow by 7.1%, Africa by 3.5%, and Asia-Pacific by over 4%.

Latin America’s shrinking millionaire class reflects deeper structural issues: persistent inequality, weak currency performance, slow economic growth, and limited wealth creation.

While other regions advance, Latin America faces the challenge of reversing these trends to restore investor confidence and promote sustainable growth.

This article was produced by The Rio Times’ automated newsroom system. How we use AI · Report an error

Read More from The Rio Times

The Rio Times · Power Map
See who really holds power in Latin America
Click to open the Power Map

Rotate for Best Experience

This report is optimized for landscape viewing. Rotate your phone for the full experience.