Iron Ore Wrap: Vale Falls 2.67% on China Steel Jitters
Today’s Focus
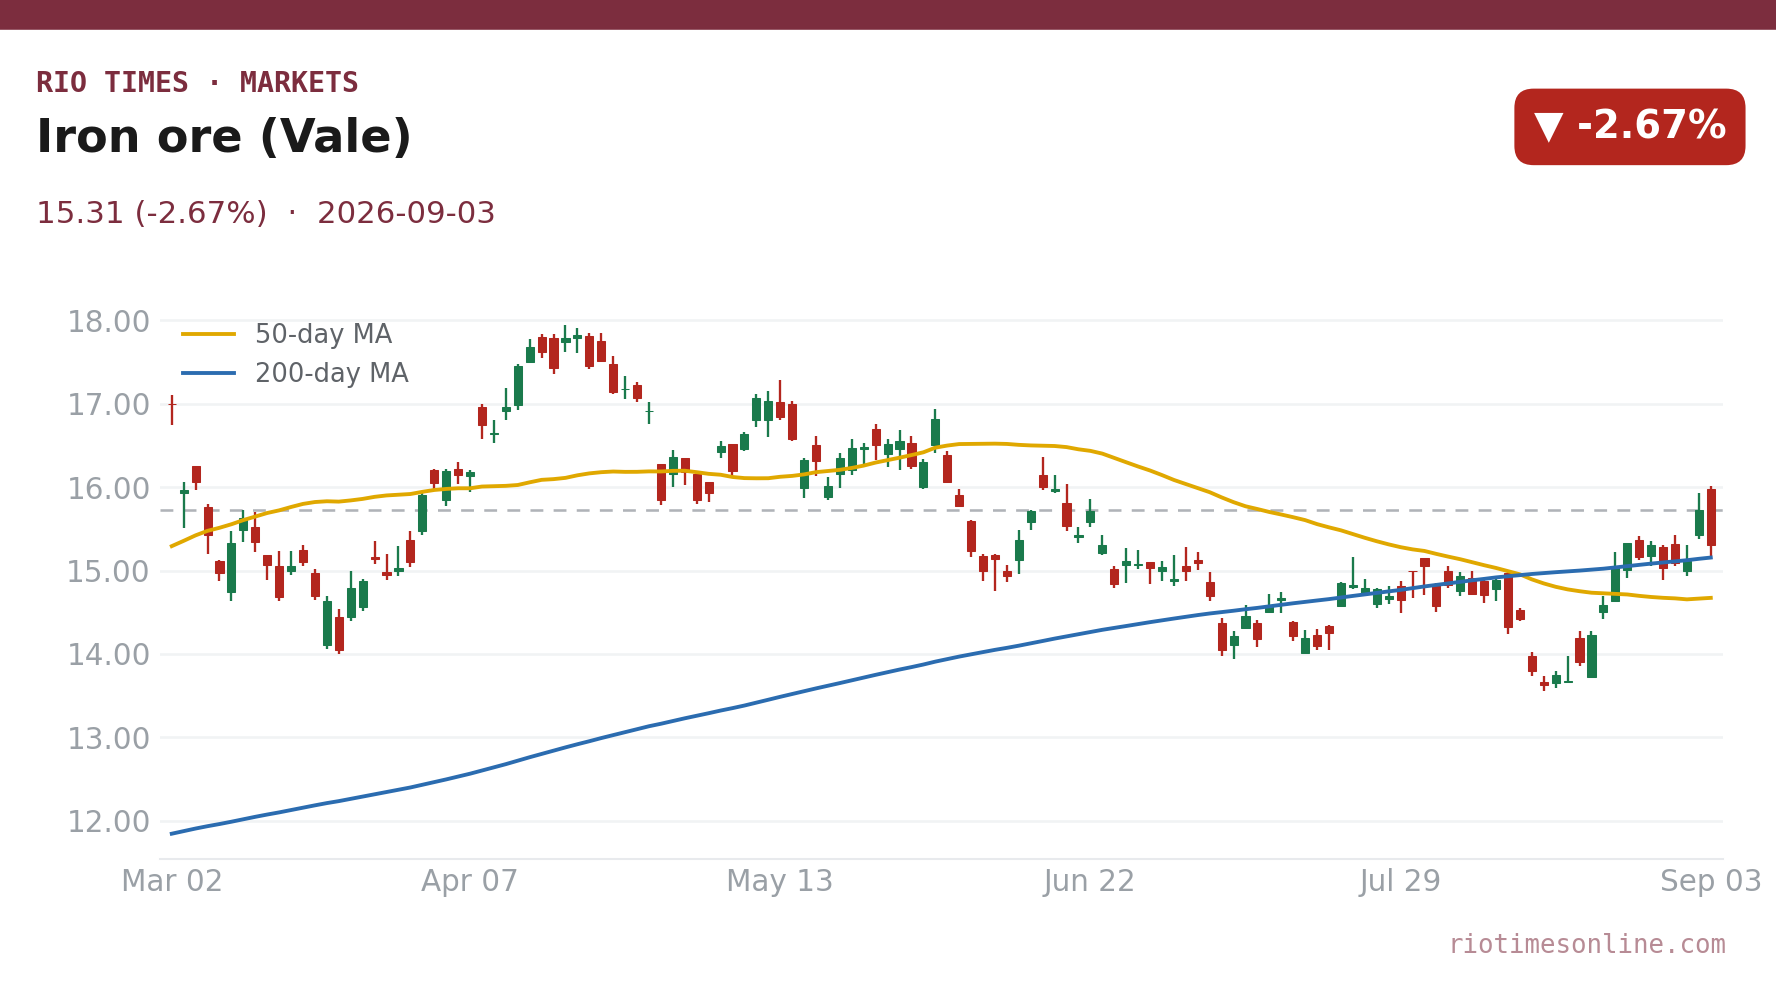
Vale’s New York shares dropped 2.67% to US$15.31 on Thursday, September 3, 2026. Traders weighed softer monthly Chinese imports against still-record annual volumes.
CSN Mineração, Vale’s smaller Brazilian rival, rose 4.06% to R$6.66 (US$1.29). The gain shows the sell-off was not a blanket vote against Brazilian iron ore producers.
China bought 108.09 million tonnes of iron ore in July, down from June. Year-to-date imports are still 5.9% higher, underpinning demand for steelmaking.
The divergence between Vale and CSN Mineração suggests the market is discriminating between volume-heavy exporters and domestic-focused miners with premium output.
What matters today. China’s monthly import dips are noise; its annual demand growth and new supply from projects like Simandou set the real price direction.
01 The session in one read
Iron ore proxies closed mixed on Thursday, September 3, 2026. Vale’s New York shares fell 2.67% to US$15.31, while CSN Mineração gained 4.06% to R$6.66 (US$1.29).
Rio Tinto, the other global bellwether, edged up 0.09% to US$102.84, reinforcing the view that the selling was selective rather than panic-driven.
The 2.67% fall in Vale shares looks like position-trimming, not a collapse in the physical market. First-seven-month imports still grew 5.9% year-on-year; watch Vale’s next production report for confirmation.
02 The board
Vale’s New York shares bore the brunt, sliding to US$15.31, since it depends heavily on seaborne iron ore sales to China.
CSN Mineração’s rise to R$6.66 (US$1.29) stands out. The miner sells more output into Brazil’s own steel industry, where demand held firmer.
Rio Tinto’s nearly flat close at US$102.84 shows diversified miners with copper and aluminium earnings are cushioned from iron ore swings.
| Asset | Level | Change |
|---|---|---|
| Iron ore (Vale) | US$15.31 | -2.67% |
| CSN Mineração | R$6.66 (US$1.29) | +4.06% |
| Rio Tinto | US$102.84 | +0.09% |
Source: RT close, 2026-09-03. Where a commodity has no spot feed, an exchange-traded tracker or leading producer is shown as a labelled proxy.
Live Market IntelligenceThe live market board
Rio Times · Live Market Intelligence
Latin America — Cross-Market Board
| Instrument | Last | Change | YoY | Prev. | High | Low | Volume |
|---|---|---|---|---|---|---|---|
| IBOV | 205,430.33 | +0.54% | +21.85% | 204,324.26 | 168,310 | 167,142 | — |
| IPSA | 11,013.03 | +0.39% | — | 10,970.29 | 11,210 | 10,984 | 1,513,213,483 |
| IPC MEX | 68,929.72 | +1.87% | +12.17% | 67,663.29 | 66,121 | 65,405 | 108,886,187 |
| MERVAL | 2,848,945 | -0.35% | +30.51% | 3,022,485 | 3,042,365 | 2,991,150 | — |
| COLCAP | 2,566.28 | -0.55% | — | 9.04 | 9.05 | 9.02 | 4,133 |
| BVL PERÚ | 60,210.69 | -0.91% | — | — | — | — | — |
| USD/BRL | 5.16 | +0.01% | -5.13% | 5.16 | 5.18 | 5.14 | — |
| EUR/BRL | 5.95 | +1.01% | -5.83% | 5.89 | 5.98 | 5.94 | — |
| USD/MXN | 17.06 | -0.24% | -8.58% | 17.10 | 17.08 | 17.01 | — |
| USD/CLP | 913.98 | +0.04% | -5.67% | 913.65 | 915.11 | 906.68 | — |
| USD/COP | 3,140 | +0.03% | -22.04% | 3,139 | 3,141 | 3,105 | — |
| USD/PEN | 3.36 | -0.66% | -4.82% | 3.38 | 3.38 | 3.35 | — |
| USD/ARS | 1,493 | +0.10% | +12.96% | 1,491 | 1,494 | 1,480 | — |
| USD/UYU | 40.27 | +1.24% | +1.80% | 39.77 | 40.27 | 40.23 | — |
| USD/PYG | 5,939 | +1.68% | -19.54% | 5,841 | 5,939 | 5,925 | — |
| USD/BOB | 11.64 | -0.76% | +72.04% | 11.73 | 11.72 | 11.64 | — |
| USD/DOP | 58.34 | +1.25% | -3.44% | 57.62 | 58.34 | 58.04 | — |
| USD/CRC | 445.92 | +0.89% | -9.71% | 441.97 | 448.50 | 445.92 | — |
Live Company IntelligenceVale SA ADR — the full investor dossier
Wall Street view
Valuation & profitability
Price & risk
$10.3652-wk high
$17.44
Revenue trend · 6y
Ownership
Dividend
03 What moved it
China’s July imports slipped to 108.09 million tonnes from June’s six-month high of 112.69 million tonnes. The 4% monthly decline gave traders a reason to book profits.
The longer view is still bullish. January-to-July imports reached 736.84 million tonnes, up 5.9% year-on-year, as low steel inventories and competitive prices kept buyers active.
Analysts forecast global iron ore shipments to China will rise by 36 to 38 million tonnes in 2026. Guinea’s Simandou project is adding new tonnes to that supply.
That leaves the market looking at a seaborne surplus of 30 to 75 million tonnes this year. The surplus caps rallies but has not yet triggered a rout.
04 The Latin American read
For Brazil, Vale is the giant. Its 2025 iron ore production hit 336.1 million tonnes, the highest since 2018, enough to surpass Rio Tinto’s Pilbara output.
Vale’s 2026 guidance calls for 335 to 345 million tonnes of iron ore. More supply from S11D, Brucutu and Capanema will reach a market already eyeing surplus.
Yet realised prices are holding. Vale’s Q1 2026 fines averaged US$95.8 per tonne, helped by a US$6.2 per tonne premium for higher-grade ore.
Regional investors should watch CSN Mineração’s relative strength, which hints that domestic steel demand and premium-grade output can decouple from China-exposed names.
05 The names to watch
Vale remains the purest proxy for seaborne iron ore sentiment. Its New York shares at US$15.31 will stay sensitive to Chinese property and infrastructure data.
CSN Mineração at R$6.66 (US$1.29) offers a Brazilian real-denominated hedge. Its higher-grade product mix and domestic steel ties give it a different demand profile.
Rio Tinto at US$102.84 is the diversification play. Its copper and aluminium divisions offset iron ore volatility and attracted steady buying on Thursday.
06 The outlook
H2 2026 prices for 62% Fe fines are forecast at US$95 to US$115 per tonne. The market is likely to trade sideways-to-soft unless Chinese steel margins improve.
The next trigger will be August Chinese import data and any shift in Shanghai rebar futures. Rebar has been hovering near 3,104 yuan per tonne, a mid-range level.
07 What to watch
- China August iron ore imports: A rebound above 110 million tonnes would ease surplus fears and support Vale shares; another dip could extend the slide.
- Simandou ramp-up: Guinea’s giant project is the largest new supply source; faster-than-expected shipments would pressure seaborne prices in H2 2026.
- Shanghai rebar futures: Any decisive move away from 3,104 yuan per tonne signals Chinese construction steel demand, the key iron ore driver.
- Vale realised premiums: Watch whether Vale’s high-grade fines premium holds near US$6.2 per tonne, as it cushions revenue even when benchmark prices dip.
Frequently Asked Questions
Why did Vale fall while CSN Mineração rose?
Vale is more exposed to Chinese seaborne volumes, which softened in July. CSN sells more into Brazil’s steadier domestic steel market and benefits from higher-grade output.
Are iron ore prices in a downtrend?
Not yet. China’s first-seven-month imports are up 5.9% year-on-year, but a forecast seaborne surplus of 30 to 75 million tonnes in 2026 caps upside.
What is the key price range for iron ore?
Analysts see 62% Fe fines trading between US$95 and US$115 per tonne in H2 2026. Risks are skewed modestly lower as new supply arrives.
How important is China to this market?
China buys roughly 75% of global seaborne iron ore. It imported 736.84 million tonnes in January-to-July 2026, making it the dominant demand driver for Vale.
Market data: RT
This article was produced by The Rio Times’ automated newsroom system. How we use AI · Report an error · Editorial responsibility: Matthias Camenzind, Editor-in-Chief
LatAm Markets: Live Signals → — real-time movers, turnover leaders and FX across Latin America.