Gold Defies Dollar Surge to Hold $5,000 While Silver Eyes First Weekly Gain in Four
\n
\n
\n
\n

\n
\n
\n
\n
\nMarket Commentary
\n
Gold is caught in a tug-of-war at the $5,000 threshold. Iran tensions are providing a strong safe-haven bid — the US military has surged transport, tanker, surveillance aircraft, and drones to bases in Qatar, Jordan, Crete, and Spain — but a strengthening dollar (+0.62% to 97.70, its fourth consecutive gain) and rising yields (10Y at 4.079%) are capping the upside. The result is a tight consolidation between $4,981 and $5,030 for the session.
This is part of The Rio Times’ daily coverage of precious metals markets and Latin American financial markets.
\n
The institutional gold narrative continues to strengthen. J.P. Morgan raised its year-end target to $6,300/oz, projecting 585 tonnes of quarterly demand from central banks and investors. UBS sees upside to $7,200 in a geopolitical escalation scenario. Goldman Sachs targets $5,400 with “significant upside risk.” Even the Reuters median poll of 30 strategists shows $4,746 — well above the current spot price adjusted for the recent correction from the $5,500+ January highs.
\n
Silver continues to stabilize after its 5% surge on Wednesday, holding above the Bollinger midline at $79.10. The Silver Institute’s latest annual outlook confirms a sixth consecutive deficit of 67 million ounces for 2026, with total supply at 1.05 billion ounces against demand that continues to exceed it. Industrial fabrication is projected to decline 2% to ~650 million ounces as PV thrifting accelerates, but physical investment demand from bars, coins, and ETPs (1.31 billion ounces in holdings) more than compensates.
\n
The precious metals complex is tracking the gold-BTC divergence. While BTC struggles below $68,000 with Fear & Greed at 11, gold holds $5,000 with central bank structural demand. The shift reflects a broader institutional preference for physical stores of value over digital alternatives in the current risk environment.
\n
US weekly jobless claims fell to 206,000 (vs 225,000 expected), reinforcing labor market strength. CME FedWatch prices the first rate cut in June at ~50% probability. The Fed’s hawkish optionality remains the primary headwind for non-yielding bullion, but geopolitical risk premia are overwhelming the rate differential.
\n
\n
\n
\n
\n
\nTechnical Analysis — Gold
\n
XAU/USD — Daily (TradingView, Feb 20 07:50 UTC, FXCM): O: 4,995.89 / H: 5,030.06 / L: 4,981.40 / C: 5,014.16 (+18.27, +0.37%). Small green candle consolidating above $5,000 for the second day, with contained range suggesting accumulation rather than distribution.
\n
Ichimoku is supportive: price sits above the Tenkan-sen at 5,006.30 and Kijun-sen at 4,999.05, with the cloud at 4,989–4,991. This is the most constructive Ichimoku configuration since mid-January — all five components are aligned for a potential bullish crossover if price sustains above the cloud. The 200-SMA at 3,909.79 is 28.2% below, confirming the long-term uptrend remains deeply intact.
\n
MACD at 96.75 (signal 75.30) remains bullish with lines above zero, though the histogram at −21.45 suggests momentum is decelerating slightly. RSI at 54.83 (signal 54.77) sits exactly at the neutral midpoint — neither overbought nor oversold, giving room for expansion in either direction.
\n
Bollinger Bands show upper at 5,345 and mid at 5,014 — price is sitting precisely at the midline, a pivotal level. A sustained close above $5,030 targets $5,100, then the February high zone near $5,345 (upper BB). Failure to hold $4,981 (session low / cloud base) opens $4,883 and the key $4,703 support (lower BB).
\n
\n
\n
\n
| Level | Price | Source |
|---|---|---|
| Resistance 3 | $5,345 | Upper Bollinger Band |
| Resistance 2 | $5,100 | Horizontal resistance / consolidation zone |
| Resistance 1 | $5,030 | Session high |
| Spot | $5,014 | Feb 20 07:50 UTC |
| Support 1 | $4,989 | Cloud top / Kijun-sen zone |
| Support 2 | $4,883 | Prior swing low |
| Support 3 | $4,703 | Lower Bollinger Band |
\n
\n
\n
\n
\n
\n
\n
\n
\nTechnical Analysis — Silver
\n
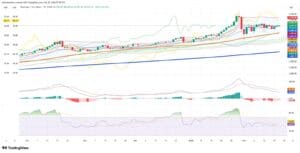
XAG/USD — Daily (TradingView, Feb 20 07:50 UTC, Capital.com): O: 78.498 / H: 79.049 / L: 77.420 / C: 78.854 (+0.357, +0.45%). Consolidation candle after Wednesday’s 5% surge, holding gains above the Bollinger midline at $79.10 — a constructive follow-through pattern.
\n
Ichimoku is bearish for silver: Tenkan-sen at 81.57 and Kijun-sen at 85.96 sit overhead, with the cloud spanning 86.00–89.61. Price trades well below all Ichimoku components, confirming the medium-term downtrend from the $121.88 January ATH remains dominant. The 200-SMA at 52.81 is 33.0% below current price, showing the long-term bull cycle is intact despite the correction.
\n
MACD at −1.110 (signal −1.255) remains negative but the gap is narrowing. Histogram at −2.365 is improving from recent lows, suggesting selling momentum is fading. RSI at 47.04 (signal 45.68) has recovered from the Feb 6 low of ~30 to near-neutral territory — a 17-point recovery indicating the oversold flush is complete.
\n
Live Market IntelligenceCommodities — Live Market Board
Rio Times · Live Market Intelligence
Commodities — Live Market Board
-0.03%
| Instrument | Last | Change | YoY | Prev. | High | Low | Volume |
|---|---|---|---|---|---|---|---|
| GOLD | 4,461 | +1.78% | +33.20% | 4,383 | 4,503 | 4,421 | 139,824 |
| SILVER | 65.59 | +1.26% | +73.05% | 64.77 | 66.98 | 64.81 | 46,406 |
| BRENT | 88.88 | -0.03% | +34.42% | 88.91 | 90.07 | 88.12 | 29,713 |
| WTI | 83.11 | -0.11% | +31.57% | 83.20 | 84.35 | 82.40 | 166,848 |
| COPPER | 6.61 | +0.03% | +46.70% | 6.61 | 6.71 | 6.61 | 39,543 |
| LITHIUM | 75.20 | +1.47% | +62.95% | 74.11 | 75.80 | 75.08 | 89,275 |
| IRON ORE | 161.91 | — | +58.10% | 161.91 | 161.91 | 1 | |
| SOY | 1,184 | +3.20% | +17.05% | 1,148 | 1,199 | 1,168 | 163,179 |
| CORN | 480.50 | +10.02% | +29.34% | 436.75 | 480.75 | 459.50 | 341,248 |
| WHEAT | 655.00 | +3.93% | +29.70% | 630.25 | 657.75 | 631.50 | 128,793 |
| COFFEE | 317.25 | -5.51% | +0.67% | 335.75 | 321.20 | 313.55 | 21,747 |
| SUGAR | 16.43 | -1.79% | -3.01% | 16.73 | 17.11 | 16.22 | 171,992 |
| COCOA | 5,719 | +3.18% | -34.96% | 5,543 | 5,779 | 5,574 | 26,773 |
| ORANGE JUICE | 138.55 | -0.47% | -45.38% | 139.20 | 141.05 | 137.50 | 703 |
| COTTON | 85.03 | +2.33% | +26.78% | 83.09 | 82.90 | 81.96 | 16,546 |
| BEEF | 223.60 | -3.93% | -5.18% | 232.75 | 226.40 | 223.00 | 16,126 |
| CATTLE | 339.10 | -3.16% | -1.82% | 350.17 | 345.50 | 338.60 | 10,164 |
| USD/BRL | 5.16 | +0.01% | -5.13% | 5.16 | 5.18 | 5.14 | — |
The $79–$81 zone is the key battleground. A close above the Tenkan-sen at $81.57 would be the first Ichimoku recovery signal. Failure to hold $77.42 (session low) targets $72 and the critical $68 support (52-week low at $68.04). Bollinger Bands are extremely wide — upper at $113.61, lower at $58.39 — reflecting the enormous volatility from the $121→$68 crash.
\n
\n
\n
\n
| Level | Price | Source |
|---|---|---|
| Resistance 3 | $89.61 | Cloud top |
| Resistance 2 | $85.96 | Kijun-sen |
| Resistance 1 | $81.57 | Tenkan-sen |
| Spot | $78.85 | Feb 20 07:50 UTC |
| Support 1 | $77.42 | Session low |
| Support 2 | $72.00 | Horizontal support / prior consolidation |
| Support 3 | $68.04 | 52-week low / cycle floor |
\n
\n
\n
\nForward Look
\n
Key Facts
—US PCE + GDP (Feb 20). Core PCE — the Fed’s preferred inflation gauge — lands today alongside Q4 GDP revision. A cool reading strengthens the rate-cut case and weakens the dollar headwind that’s capping gold at $5,030. A hot print reinforces “higher for longer” and tests gold’s geopolitical bid against its rate-sensitivity floor.
—Iran timeline ticking. Trump’s 10-to-15-day deadline puts the decision window in early March. Any reports of kinetic military action would trigger an immediate safe-haven surge — UBS’s $7,200 upside scenario specifically prices escalation to armed conflict. De-escalation would remove the risk premium that’s been supporting gold above $5,000 this week.
—Silver weekly close. Silver is on track for its first positive weekly close in four weeks. A Friday close above $79 would confirm the $76–$80 industrial buyer floor and signal the correction from $121.88 has found a base. Physical premiums remain elevated, and silver lease rates above 5% confirm genuine scarcity.
—Central bank demand pipeline. Brazil’s Banco Central added 31 tonnes in recent months. China’s PBOC has bought gold for 12 consecutive months. J.P. Morgan projects 585 tonnes per quarter in combined central bank and investor demand — well above the 350-tonne threshold needed for prices to rise each quarter.
\n
\n
\n
Key Facts
— Gold’s ability to hold $5,000 against a surging dollar confirms the structural bid — Iran is the accelerant, but central bank demand is the foundation.
— The Ichimoku configuration on gold is the most constructive since mid-January. Price is above both the Tenkan and Kijun, sitting at the Bollinger midline with RSI neutral at 54.83. This is a market coiling for a directional move, not one in distress. The institutional forecasts — J.P. Morgan at $6,300, UBS at $6,000–$7,200, Deutsche Bank and SocGen at $6,000 — provide a consensus floor well above current levels.
— Silver’s technical picture is more damaged but the fundamental case is strengthening. A sixth consecutive supply deficit, 35% correction from ATH, and industrial buyers aggressively accumulating in the $76–$80 zone create an asymmetric setup. RSI’s recovery from 30 to 47 without a new price low is textbook base-building.
— Today’s PCE data is the session catalyst. Cool inflation gives gold the rate-cut tailwind to break $5,030. Hot data tests whether Iran’s geopolitical bid alone can hold $5,000 against both dollar strength and yield pressure.
— Technical bias — Gold: Bullish above $5,000; Neutral at $4,883–$5,000; Bearish below $4,883. Silver: Neutral at $77–$82; Bullish above $82 (Tenkan recovery).
\n
\n
\n
Related coverage: Brazil’s Ibovespa | Brazil’s Morning Call
This article was produced by The Rio Times’ automated newsroom system. How we use AI · Report an error · Editorial responsibility: Matthias Camenzind, Editor-in-Chief
Read More from The Rio Times