
\n
\n
\n
\n
\n
\n
\n
\n
\n
\n
\n
\n
\n
\n
\n
\n
\n
\n
\n
\nGold bounces 1.06% to $4,930 after yesterday’s $134 intraday plunge, reclaiming the Ichimoku cloud as dip-buyers defend the $4,853 low ahead of today’s FOMC minutes. XAU/USD opened at $4,879 — essentially at yesterday’s close — and ground steadily higher through the Asian session to reach $4,941 before settling at $4,930. The recovery closes a large portion of yesterday’s bearish engulfing candle but remains $70 below the critical $5,000 level. The daily low of $4,853.72 briefly pierced the Ichimoku cloud base ($4,883) but buyers stepped in decisively, creating a long lower wick that signals demand below $4,860. Gold is now trading just above the Senkou Span A ($4,887), keeping the cloud intact — for now.
\n
\nSilver surges nearly 3% to $75.65, outperforming gold on the recovery as the white metal reclaims the $75 handle from yesterday’s devastating $72.28 low. XAG/USD printed O: 73.37 / H: 76.09 / L: 72.28 / C: 75.65 — a $3.82 intraday range that rivals last week’s most volatile sessions. The gold-silver ratio tightened to 65.2 from 65.6, reflecting silver’s higher-beta on the upside just as it amplified yesterday’s downside. Silver’s 2.95% gain outpaces gold’s 1.06%, suggesting risk appetite is creeping back into the metals complex. However, the Kijun-sen at $75.65 is acting as a ceiling, meaning the rally has stalled precisely at the equilibrium line — a critical juncture for any continuation higher.
\n
\nFOMC minutes release today is the week’s highest-conviction catalyst, arriving as Einhorn’s “substantially more than two cuts” thesis collides with a slightly firmer dollar. The DXY has ticked up to 97.13 (+0.19%), extending a modest rebound from its 4-year low as markets reprice rate expectations ahead of the January meeting minutes. David Einhorn of Greenlight Capital — who gained notoriety calling Lehman Brothers’ collapse — told CNBC last week that betting on more Fed cuts is “one of the best trades out there right now,” citing gold as “becoming the reserve asset” for central banks globally. JPMorgan has raised its gold target to $6,300/oz. But the dollar’s stabilization above 97 adds a headwind: if the minutes strike a hawkish tone, the DXY rebound could accelerate and pressure gold back below $4,883.
\n
\n
\n
\nSession Data
\n
| Asset | Price | Change |
|---|---|---|
| XAU/USD (Gold) | $4,930.24 | +1.06% |
| XAG/USD (Silver) | $75.649 | +2.95% |
| DXY (Dollar Index) | 97.13 | +0.19% |
| S&P 500 Futures | 6,860.00 | +0.25% |
| VIX | 20.29 | −4.29% |
| US 10Y Yield | 4.056% | flat |
| Gold/Silver Ratio | 65.17 | ▼ from 65.6 |
| BTC/USD | $67,720 | −0.89% |
| Gold 52-Week Range | $2,866 – $5,627 | −12.4% from ATH |
| Silver 52-Week Range | $28.16 – $121.67 | −37.8% from ATH |
\n
\n
\n
\nMarket Commentary
\n
Dip-buyers are back. After yesterday’s 1.49% plunge — gold’s largest single-session decline since the February 6 capitulation — the metal has staged a textbook recovery in the Asian session, grinding from $4,879 to $4,941 before settling at $4,930. The intraday low of $4,853.72 briefly pierced the Ichimoku cloud base ($4,883) but the breach was decisively rejected, creating a long lower wick that signals institutional buying below $4,860. This is the same pattern that played out on February 6 (the $4,404 low) and February 10 (the $4,822 retest): violent selloffs followed by V-shaped recoveries that never allow the lows to hold for more than a few hours.
This is part of The Rio Times’ daily coverage of precious metals markets and Latin American financial markets.
\n
Silver’s 2.95% bounce is even more striking, with XAG/USD recovering from a $72.28 low to close at $75.65 — reclaiming the entire $75 handle that was lost yesterday. The gold-silver ratio has compressed from 65.6 to 65.2, reflecting silver’s higher-beta behavior on the recovery. The $72.28 low marks a near-perfect double bottom with the $72.74 low from yesterday, creating a short-term demand zone in the $72.00–$72.80 range that will be critical to monitor if selling resumes.
\n
The backdrop is more nuanced than a simple dead-cat bounce. The DXY has ticked higher to 97.13 (+0.19%), extending a modest rebound from its 4-year low — not ideal for gold bulls, but a far cry from the kind of dollar strength that would sustain a metals selloff. The VIX has dropped 4.29% to 20.29, and S&P 500 futures are up 0.25%, suggesting equity markets are digesting last week’s volatility constructively. The 10-year yield is flat at 4.056%, holding near the bottom of its February range and providing no additional headwind for non-yielding bullion.
\n
The smart money positioning is worth noting. David Einhorn of Greenlight Capital — who gained his reputation calling Lehman’s collapse — told CNBC last week that the Fed will cut “substantially more than two times” this year, calling it “one of the best trades out there right now.” He’s long gold and SOFR futures, betting that Kevin Warsh as Fed Chair will persuade the committee to ease more aggressively, even in a relatively hot economy. JPMorgan has raised its gold forecast to $6,300/oz, projecting central bank demand of ~585 tonnes/quarter. Goldman Sachs targets $4,900 by December 2026, while Wells Fargo has the most bullish call on the Street at $6,100–$6,300 year-end. Against this institutional backdrop, today’s FOMC minutes become the catalyst that could validate or challenge the rate-cut consensus — and with it, the entire post-crash gold recovery.
\n
\n
\n
\n
\n
\nTechnical Analysis
\n
Gold (XAU/USD) — Daily (TradingView, Feb 18 07:53 UTC, FXCM): Today’s candle prints O: 4,878.57 / H: 4,940.95 / L: 4,853.72 / C: 4,930.24 (+51.67, +1.06%). This is a bullish hammer-style candle with a long lower wick ($77 below the close) and a relatively small body, forming inside yesterday’s bearish engulfing range — a textbook hammer after a selloff. Price has recovered back above the Ichimoku cloud (Senkou Span A: $4,887.02, Span B: $4,883.48) after briefly piercing it, which keeps the medium-term bullish structure intact. The Tenkan-sen at $4,987.55 remains overhead resistance. MACD reads 107.54 vs. signal 77.28, both positive but with the histogram at −30.27 — slightly worse than yesterday’s −26.35, indicating the bearish crossover is still deepening even as price bounces. This divergence between rising price and deteriorating MACD warrants caution. RSI at 54.19 (signal 52.08) is essentially neutral, having stabilized above 50 after yesterday’s decline from 56.74 — not yet confirming bullish momentum.
\n
\n
\n
\n
Silver (XAG/USD) — Daily (TradingView, Feb 18 07:53 UTC, Capital.com): Today’s candle prints O: 73.366 / H: 76.094 / L: 72.277 / C: 75.649 (+2.166, +2.95%). This is a powerful bullish reversal candle — a long lower wick extending to $72.28 with a close near the session high at $75.65. Notably, the close lands precisely on the Kijun-sen ($75.649), making this equilibrium line the immediate battleground. The MACD line has crossed below zero to −0.407 (signal −2.201), with the histogram at −2.608 — slightly worse than yesterday’s −2.414. Like gold, the MACD diverges from price action, warning that the momentum structure remains bearish even as the candle looks constructive. RSI at 45.28 (signal 44.41) is still below 50, confirming silver’s momentum hasn’t turned positive yet. The 200-SMA at $51.84 remains the distant floor, while the Bollinger midline at $59.56 represents a realistic downside target if the recovery fails.
\n
\n
\n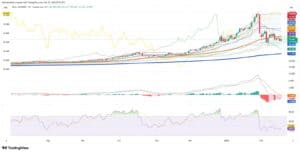
\n
\n
\n
\n
| Level | Gold (XAU) | Silver (XAG) | Source |
|---|---|---|---|
| Resistance 3 | $5,108 | $88.03 | Prior range high / Jan consolidation |
| Resistance 2 | $5,000 | $80.84 | Psychological / Ichimoku cloud top |
| Resistance 1 | $4,988 | $78.28 | Tenkan-sen / Tenkan-sen |
| Spot | $4,930 | $75.65 | Feb 18 07:53 UTC |
| Support 1 | $4,883 | $72.28 | Ichimoku cloud base / session low |
| Support 2 | $4,854 | $70.00 | Intraday low / psychological |
| Support 3 | $3,892 | $51.84 | 200-day SMA |
\n
\n
\n
\nForward Look
\n
FOMC Minutes (today): The single most important catalyst this week, and it arrives with gold in a technically vulnerable but recovering position. The January meeting minutes will reveal the committee’s thinking on the rate path after holding at 3.50–3.75%. Markets are pricing ~10% odds of a March cut and ~62bps of total easing by year-end (roughly two-and-a-half cuts). Dovish language — particularly any acknowledgment of the disinflation trend (CPI at 2.4%, core at 2.5%) or discussion of productivity-driven easing — would validate the Einhorn thesis and likely push gold back above $5,000 within the session. Hawkish surprises, especially around the 10-2 vote split or pushback on near-term cuts, could reverse this morning’s bounce and retest $4,854.
\n
Data gauntlet (Wed–Thu): Initial jobless claims tomorrow (last print 227K, above 222K estimate) will provide real-time labor market signal. Thursday brings Q4 GDP data and February Manufacturing & Services PMI — a trifecta that could reshape the macro narrative. Weak growth readings would accelerate rate-cut expectations and provide a structural bid for bullion.
\n
Dollar headwind building: The DXY’s bounce to 97.13 is modest but notable — the dollar index rose to above 97.5 intraday yesterday as markets reassessed relative rate expectations. Slower UK wage growth is pressuring the pound, and Canadian dollar weakness from declining underlying inflation are aiding the greenback. If the FOMC minutes lean hawkish, the DXY could push through 97.5 and create a meaningful headwind for gold’s recovery.
\n
Institutional consensus remains bullish: JPMorgan raised its gold forecast to $6,300/oz (from $5,055 previously projected for Q4 2026). Goldman Sachs targets $4,900 by Dec 2026. Wells Fargo maintains the street-high at $6,100–$6,300 year-end. Deutsche Bank at $6,000/oz. Central bank demand is projected at ~585 tonnes/quarter (JPM), with PBoC buying for 15 consecutive months and Shanghai Futures Exchange volumes at 540 tonnes daily YTD. David Einhorn calls gold “the reserve asset” and rates it as one of the best trades available. The structural thesis is unanimous among major houses — the only question is whether the tactical correction has further to run before the next leg higher.
\n
\n
\n
\n
\n
Key Facts
— Gold’s hammer candle at $4,854 says dip-buyers aren’t done — but FOMC minutes will decide if $5,000 is a ceiling or a stepping stone.
— Today’s price action is constructive but not conclusive. The bullish hammer on gold and the strong reversal candle on silver argue that the $4,854–$4,883 zone is becoming a well-defended support level — three tests of this area in two sessions, all rejected by aggressive buying. However, the MACD warns against complacency: the histogram has deteriorated for a third consecutive session (−30.27 vs. −26.35 vs. −20.11), creating a bearish divergence with price that suggests the underlying momentum structure is weakening even as candles look bullish. Silver’s RSI below 50 (45.28) reinforces this caution. The Einhorn thesis — “substantially more than two cuts” — and JPMorgan’s $6,300 target provide a powerful medium-term anchor, but the market needs today’s FOMC minutes to validate that view. A dovish release would likely trigger a swift reclaim of $5,000 with potential to extend toward $5,040–$5,108 by end of week. A hawkish surprise would expose the MACD divergence as a leading indicator and risk a retest of $4,854 and potentially $4,822 (the Feb 10 low). The gold-silver ratio compressing from 65.6 to 65.2 on silver’s outperformance is a marginally bullish signal — historically, silver leading the recovery is associated with improving risk appetite and sustained upside in the metals complex. Technical bias: Neutral pre-FOMC; turning Bullish on a daily close above $4,988 (Tenkan-sen) or Bearish on a close below $4,883 (cloud base).
\n
Related coverage: Brazil’s Ibovespa | Brazil’s Morning Call
This article was produced by The Rio Times’ automated newsroom system. How we use AI · Report an error · Editorial responsibility: Matthias Camenzind, Editor-in-Chief
Read More from The Rio Times