IBOV 185,147.15 ▼ 0.02% IPSA 11,315.26 ▼ 1.14% IPC MEX 65,163.64 ▼ 0.42% MERVAL 3,049,121 ▼ 0.29% COLCAP 2,544.56 ▲ 0.40% BVL PERÚ 59,978.22 ▼ 0.31% USD/BRL5.12▲ 0.31% USD/MXN16.88▼ 0.24% USD/CLP933.68▲ 0.29% USD/COP3,124▼ 1.12% USD/PEN3.35▼ 0.34% USD/ARS1,509▲ 0.01% USD/UYU40.24▲ 1.26% USD/PYG5,947▲ 2.52% USD/BOB12.40▲ 3.51% USD/DOP59.00▲ 0.85% USD/CRC448.67▲ 1.62% USD/GTQ7.63▲ 2.29% USD/HNL26.84▲ 0.28% USD/NIO36.62▲ 0.07% USD/VES805.37▼ 0.13% USD/PAB1.00— 0.00% USD/BZD2.00— 0.00% USD/JMD 157.28 — 0.00% USD/TTD6.71▲ 0.91% EUR/BRL5.95▲ 0.91% BRENT 88.88 ▼ 0.03% WTI 83.11 ▼ 0.11% IRON ORE 161.91 — — COPPER 6.61 ▲ 0.03% GOLD 4,461 ▲ 1.78% SILVER 65.59 ▲ 1.26% SOY 1,184 ▲ 3.20% CORN 480.50 ▲ 10.02% WHEAT 655.00 ▲ 3.93% COFFEE 317.25 ▼ 5.51% SUGAR 16.43 ▼ 1.79% ORANGE JUICE 138.55 ▼ 0.47% COTTON 85.03 ▲ 2.33% COCOA 5,719 ▲ 3.18% BEEF 223.60 ▼ 3.93% CATTLE 339.10 ▼ 3.16% LITHIUM 75.20 ▲ 1.47% PETR4 41.64 ▼ 0.05% VALE3 72.97 ▲ 0.83% ITUB4 38.60 ▼ 1.03% BBDC4 16.85 ▲ 0.36% ABEV3 14.89 ▼ 0.80% BBAS3 19.37 ▲ 0.47% B3SA3 14.26 ▼ 0.21% WEGE3 47.59 ▲ 0.49% PRIO3 59.14 ▼ 0.19% SUZB3 41.33 ▲ 2.35% RENT3 34.68 ▼ 0.09% AZZA3 15.89 ▼ 2.63% CSAN3 3.22 ▼ 1.83% RAIZ4 0.25 — 0.00% PCAR3 2.75 ▼ 0.36% GMAT3 3.65 ▼ 1.08% PSSA3 48.13 ▼ 0.54% CVCB3 1.33 ▼ 2.92% POSI3 3.36 ▲ 2.44% SLCE3 13.34 ▲ 0.30% NATU3 8.14 ▼ 0.73% IBOV 185,147.15 ▼ 0.02% IPSA 11,315.26 ▼ 1.14% IPC MEX 65,163.64 ▼ 0.42% MERVAL 3,049,121 ▼ 0.29% COLCAP 2,544.56 ▲ 0.40% BVL PERÚ 59,978.22 ▼ 0.31% USD/BRL 5.16 ▲ 0.01% USD/MXN 17.06 ▼ 0.24% USD/CLP 913.98 ▲ 0.04% USD/COP 3,140 ▲ 0.03% USD/PEN 3.36 ▼ 0.66% USD/ARS 1,493 ▲ 0.10% USD/UYU 40.27 ▲ 1.24% USD/PYG 5,939 ▲ 1.68% USD/BOB 11.64 ▼ 0.76% USD/DOP 58.34 ▲ 1.25% USD/CRC 445.92 ▲ 0.89% USD/GTQ 7.62 ▲ 2.21% USD/HNL 26.79 ▲ 1.57% USD/NIO 36.62 ▲ 0.69% USD/VES 762.44 ▼ 0.13% USD/PAB 1.00 — 0.00% USD/BZD 2.00 — 0.00% USD/JMD 157.28 — 0.00% USD/TTD 6.70 ▲ 0.61% EUR/BRL 5.95 ▲ 1.01% BRENT 88.88 ▼ 0.03% WTI 83.11 ▼ 0.11% IRON ORE 161.91 — — COPPER 6.61 ▲ 0.03% GOLD 4,461 ▲ 1.78% SILVER 65.59 ▲ 1.26% SOY 1,184 ▲ 3.20% CORN 480.50 ▲ 10.02% WHEAT 655.00 ▲ 3.93% COFFEE 317.25 ▼ 5.51% SUGAR 16.43 ▼ 1.79% ORANGE JUICE 138.55 ▼ 0.47% COTTON 85.03 ▲ 2.33% COCOA 5,719 ▲ 3.18% BEEF 223.60 ▼ 3.93% CATTLE 339.10 ▼ 3.16% LITHIUM 75.20 ▲ 1.47% PETR4 41.64 ▼ 0.05% VALE3 72.97 ▲ 0.83% ITUB4 38.60 ▼ 1.03% BBDC4 16.85 ▲ 0.36% ABEV3 14.89 ▼ 0.80% BBAS3 19.37 ▲ 0.47% B3SA3 14.26 ▼ 0.21% WEGE3 47.59 ▲ 0.49% PRIO3 59.14 ▼ 0.19% SUZB3 41.33 ▲ 2.35% RENT3 34.68 ▼ 0.09% AZZA3 15.89 ▼ 2.63% CSAN3 3.22 ▼ 1.83% RAIZ4 0.25 — 0.00% PCAR3 2.75 ▼ 0.36% GMAT3 3.65 ▼ 1.08% PSSA3 48.13 ▼ 0.54% CVCB3 1.33 ▼ 2.92% POSI3 3.36 ▲ 2.44% SLCE3 13.34 ▲ 0.30% NATU3 8.14 ▼ 0.73%
since 2009
Friday, September 4, 2026

Brazil’s Wind and Solar Energy Boom Hits a Hard Wall

By · June 26, 2025 · 2 min read

Daily Brief

The morning intel from across Latin America. Free.

By subscribing you agree to our privacy policy. We never share your email.

Brazil’s wind and solar energy industries, once seen as models for clean power, now face their biggest crisis in two decades.

Official figures from the Brazilian Wind Energy Association (ABEEólica), the National Electric System Operator (ONS), and the Ministry of Mines and Energy show that rapid growth has run into serious problems.

Brazil built solar and wind farms faster than almost any other country. In 2023, Brazil became the world’s third largest market for new renewable energy, adding 14.2 gigawatts of solar and 4.8 gigawatts of wind power.

Renewables now make up more than 90% of Brazil’s electricity, with wind and solar accounting for over 17%. Most of this new energy comes from the Northeast, but the big cities and industries that use the most electricity are in the Southeast.

This mismatch has created a major bottleneck. The country’s power grid does not have enough transmission lines to move all that clean energy to where it is needed.
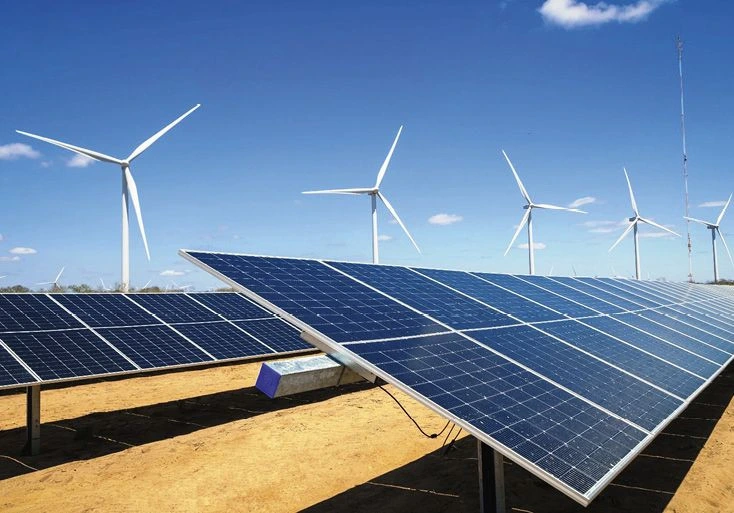
Brazil’s Wind and Solar Energy Boom Hits a Hard Wall
Brazil’s Wind and Solar Energy Boom Hits a Hard Wall.
One-stop reference
Company Intelligence
Every listed company in Latin America — financials, ownership and structure for 1,450+ companies across 26 exchanges, in one place.
Browse the directory →
RT
Ask Rio Times
17 years of Latin America reporting, on demand.
Open the full Ask Rio Times →

As a result, ONS has forced wind and solar plants to cut back production, sometimes wasting up to 60% of what they could generate in a month.

These forced cuts, called “curtailments,” have cost companies at least 1.7 billion reais (about $211 million) in losses in just over a year. The financial pain is spreading. Since 2024, wind energy companies have cut 11,000 jobs.

Brazil’s Clean Energy Sector Faces Crisis

Major manufacturers, like Aeris and GE Vernova, have closed factories or laid off workers. New wind farm projects dropped from 123 in 2023 to 76 in 2024. Solar companies are also struggling, with some seeking court protection from creditors as revenue drops by as much as 60%.

Regulatory changes have made things worse. Until 2023, wind and solar producers received full compensation for energy they could not deliver because of grid limits. Now, they recover only about 3% of their losses, while fossil fuel plants still get full pay.

This has discouraged new investment and triggered lawsuits from industry groups seeking fairer treatment. High interest rates—now at 15%—have made borrowing more expensive, squeezing companies further.

The government has delayed auctions for new transmission lines and energy storage, so relief may not come soon. Experts say new lines could take up to a decade to build.

Brazil’s clean energy crisis shows what happens when growth outpaces infrastructure. Without enough transmission lines and fair rules, even the best renewable plans can stall.

The country’s experience is a warning for others: building more green power is not enough—you need the wires and policies to make it work.

This article was produced by The Rio Times’ automated newsroom system. How we use AI · Report an error

Read More from The Rio Times

The Rio Times · Power Map
See who really holds power in Latin America
Click to open the Power Map

Rotate for Best Experience

This report is optimized for landscape viewing. Rotate your phone for the full experience.