IBOV 186,595.60 ▲ 0.74% IPSA 11,357.82 ▼ 0.21% IPC MEX 63,375.93 ▼ 0.78% MERVAL 2,998,956 ▼ 0.76% COLCAP 2,565.55 ▲ 0.68% BVL PERÚ 59,344.04 ▲ 0.31% USD/BRL5.10▼ 0.74% USD/MXN17.20▼ 0.16% USD/CLP946.95▼ 1.30% USD/COP3,193▲ 0.57% USD/PEN3.37▼ 0.09% USD/ARS1,514▼ 0.03% USD/UYU40.14▼ 0.05% USD/PYG5,926▲ 0.34% USD/BOB10.95▲ 10.05% USD/DOP59.26▲ 0.87% USD/CRC443.27▼ 0.27% USD/GTQ7.63▼ 0.05% USD/HNL26.86▲ 0.03% USD/NIO36.62— 0.00% USD/VES847.44▼ 0.13% USD/PAB1.00— 0.00% USD/BZD2.00— 0.00% USD/JMD 157.28 — 0.00% USD/TTD6.76▲ 0.17% EUR/BRL5.86▼ 0.83% BRENT 88.88 ▼ 0.03% WTI 83.11 ▼ 0.11% IRON ORE 161.91 — — COPPER 6.61 ▲ 0.03% GOLD 4,461 ▲ 1.78% SILVER 65.59 ▲ 1.26% SOY 1,184 ▲ 3.20% CORN 480.50 ▲ 10.02% WHEAT 655.00 ▲ 3.93% COFFEE 317.25 ▼ 5.51% SUGAR 16.43 ▼ 1.79% ORANGE JUICE 138.55 ▼ 0.47% COTTON 85.03 ▲ 2.33% COCOA 5,719 ▲ 3.18% BEEF 223.60 ▼ 3.93% CATTLE 339.10 ▼ 3.16% LITHIUM 75.20 ▲ 1.47% PETR4 41.64 ▼ 0.05% VALE3 72.97 ▲ 0.83% ITUB4 38.60 ▼ 1.03% BBDC4 16.85 ▲ 0.36% ABEV3 14.89 ▼ 0.80% BBAS3 19.37 ▲ 0.47% B3SA3 14.26 ▼ 0.21% WEGE3 47.59 ▲ 0.49% PRIO3 59.14 ▼ 0.19% SUZB3 41.33 ▲ 2.35% RENT3 34.68 ▼ 0.09% AZZA3 15.89 ▼ 2.63% CSAN3 3.22 ▼ 1.83% RAIZ4 0.25 — 0.00% PCAR3 2.75 ▼ 0.36% GMAT3 3.65 ▼ 1.08% PSSA3 48.13 ▼ 0.54% CVCB3 1.33 ▼ 2.92% POSI3 3.36 ▲ 2.44% SLCE3 13.34 ▲ 0.30% NATU3 8.14 ▼ 0.73% IBOV 186,595.60 ▲ 0.74% IPSA 11,357.82 ▼ 0.21% IPC MEX 63,375.93 ▼ 0.78% MERVAL 2,998,956 ▼ 0.76% COLCAP 2,565.55 ▲ 0.68% BVL PERÚ 59,344.04 ▲ 0.31% USD/BRL 5.16 ▲ 0.01% USD/MXN 17.06 ▼ 0.24% USD/CLP 913.98 ▲ 0.04% USD/COP 3,140 ▲ 0.03% USD/PEN 3.36 ▼ 0.66% USD/ARS 1,493 ▲ 0.10% USD/UYU 40.27 ▲ 1.24% USD/PYG 5,939 ▲ 1.68% USD/BOB 11.64 ▼ 0.76% USD/DOP 58.34 ▲ 1.25% USD/CRC 445.92 ▲ 0.89% USD/GTQ 7.62 ▲ 2.21% USD/HNL 26.79 ▲ 1.57% USD/NIO 36.62 ▲ 0.69% USD/VES 762.44 ▼ 0.13% USD/PAB 1.00 — 0.00% USD/BZD 2.00 — 0.00% USD/JMD 157.28 — 0.00% USD/TTD 6.70 ▲ 0.61% EUR/BRL 5.95 ▲ 1.01% BRENT 88.88 ▼ 0.03% WTI 83.11 ▼ 0.11% IRON ORE 161.91 — — COPPER 6.61 ▲ 0.03% GOLD 4,461 ▲ 1.78% SILVER 65.59 ▲ 1.26% SOY 1,184 ▲ 3.20% CORN 480.50 ▲ 10.02% WHEAT 655.00 ▲ 3.93% COFFEE 317.25 ▼ 5.51% SUGAR 16.43 ▼ 1.79% ORANGE JUICE 138.55 ▼ 0.47% COTTON 85.03 ▲ 2.33% COCOA 5,719 ▲ 3.18% BEEF 223.60 ▼ 3.93% CATTLE 339.10 ▼ 3.16% LITHIUM 75.20 ▲ 1.47% PETR4 41.64 ▼ 0.05% VALE3 72.97 ▲ 0.83% ITUB4 38.60 ▼ 1.03% BBDC4 16.85 ▲ 0.36% ABEV3 14.89 ▼ 0.80% BBAS3 19.37 ▲ 0.47% B3SA3 14.26 ▼ 0.21% WEGE3 47.59 ▲ 0.49% PRIO3 59.14 ▼ 0.19% SUZB3 41.33 ▲ 2.35% RENT3 34.68 ▼ 0.09% AZZA3 15.89 ▼ 2.63% CSAN3 3.22 ▼ 1.83% RAIZ4 0.25 — 0.00% PCAR3 2.75 ▼ 0.36% GMAT3 3.65 ▼ 1.08% PSSA3 48.13 ▼ 0.54% CVCB3 1.33 ▼ 2.92% POSI3 3.36 ▲ 2.44% SLCE3 13.34 ▲ 0.30% NATU3 8.14 ▼ 0.73%
since 2009
Monday, September 21, 2026

Latin America Mexico

Tariffs, Cuts, and Uncertainty Drive Mexico’s Worst Industrial Semester in Five Years

By · August 11, 2025 · 2 min read

The LatAm Brief

One email, every weekday morning. What moved in Latin American markets, politics and expat life.

Yesterday’s subject line: “Venezuela's New York week: oil signed, the bounty stays”

Free. We send a confirmation link first — nothing arrives until you click it. Unsubscribe with one click in any edition. If you stop opening us for 30 days we stop sending by ourselves, as we assume the interest is no longer there. See our privacy policy. We never share your email.

Mexico’s industrial activity stalled in June 2025, marking the end of a rough six-month period. Official data from the National Institute of Statistics and Geography (INEGI) reveals a 1.3% drop in output for the first half of the year.

This marks the harshest semester since the pandemic crisis of 2020. June cemented the negative trend. Activity dipped 0.1% from May, as three of four major sectors lost ground.

Mining led the decline with a 1.4% drop, pushed by weaker oil and gas production. Utilities—electricity, gas, water—and construction both fell 0.2%. Only manufacturing edged up, but its 0.3% gain was too slight to offset wider losses.

This downturn did not come suddenly. Over the past year, Mexican industry saw nine months of falling output and four straight months of year-on-year declines. The contraction cut across sectors.

Mining plunged 8.8% in the semester. Utilities dropped 2.1%, construction fell 1.1%, and civil engineering works collapsed by 24.6% due to public investment cuts.

Manufacturing stayed just above water, with 0.1% growth; however, 13 of its 21 subsectors shrank, including wood products (-7.1%), leather (-6.2%), clothing (-6.1%), non-metal minerals (-5.4%), and textiles (-4.8%).

Only a handful of areas grew, such as miscellaneous manufacturing (+27.4%) and electrical accessories (+3.5%). Two main forces weighed on the industry. First, trade uncertainty looms large.
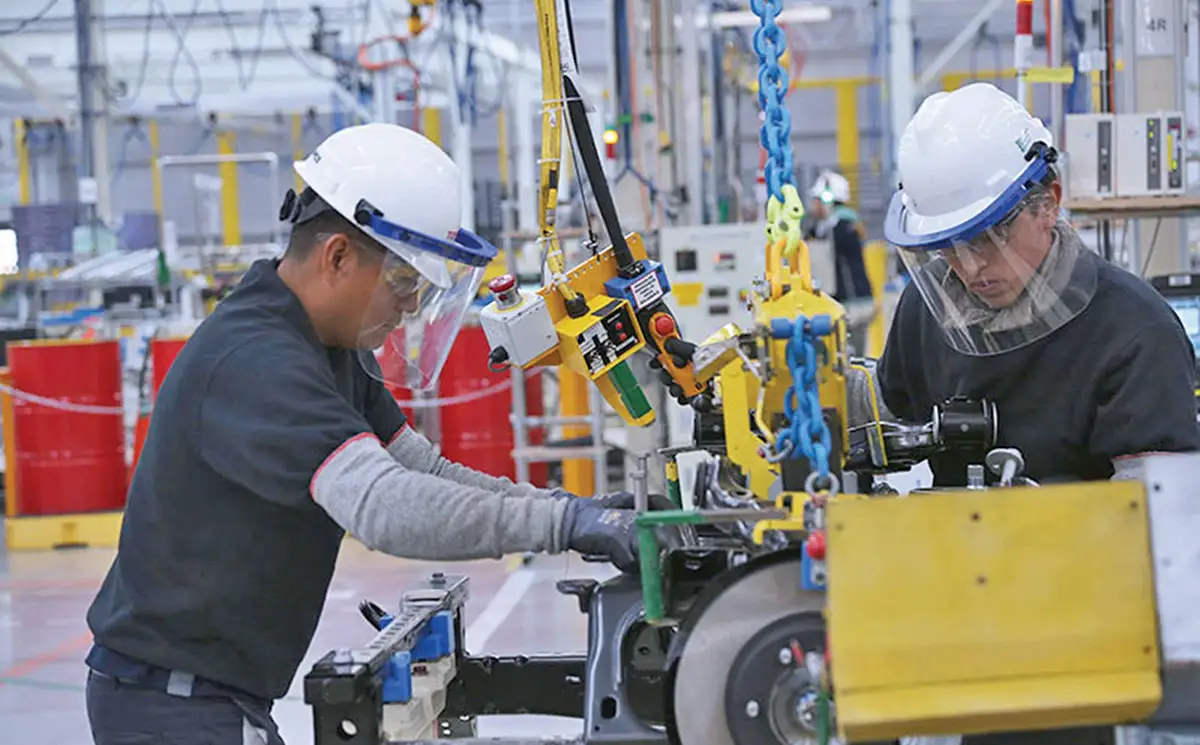
Tariffs, Cuts, and Uncertainty Drive Mexico’s Worst Industrial Semester in Five Years
Tariffs, Cuts, and Uncertainty Drive Mexico’s Worst Industrial Semester in Five Years.
One-stop reference
Company Intelligence
Every listed company in Latin America — financials, ownership and structure for 1,450+ companies across 26 exchanges, in one place.
Browse the directory →
RT
Ask Rio Times
17 years of Latin America reporting, on demand.
Open the full Ask Rio Times →

New U.S. tariffs on metals and vehicles raised costs for Mexican manufacturers and clouded the future of the cross-border USMCA deal.

Because autos and parts represent the bulk of Mexico’s exports, this instability matters for every factory worker and supplier linked to the U.S. market.

Second, domestic policy changes created headwinds. Judicial reforms replacing top judges, new regulators in telecom and competition, and stronger state control in energy injected unpredictability into the business climate.

The government cut its fiscal deficit from 5.7% of GDP in 2024 to 3.9% this year, slashing public works vital for the construction sector.

For international readers, the June slowdown marks more than just temporary trouble. It signals deeper shifts in Mexico’s trade relations, investment confidence, and the balance between government and private industry.

This article was produced by The Rio Times’ automated newsroom system. How we use AI · Report an error

Read More from The Rio Times

The Rio Times · Power Map
See who really holds power in Latin America
Click to open the Power Map

Rotate for Best Experience

This report is optimized for landscape viewing. Rotate your phone for the full experience.