South Africa Markets: JSE & the Rand — October 1, 2026
Key Facts
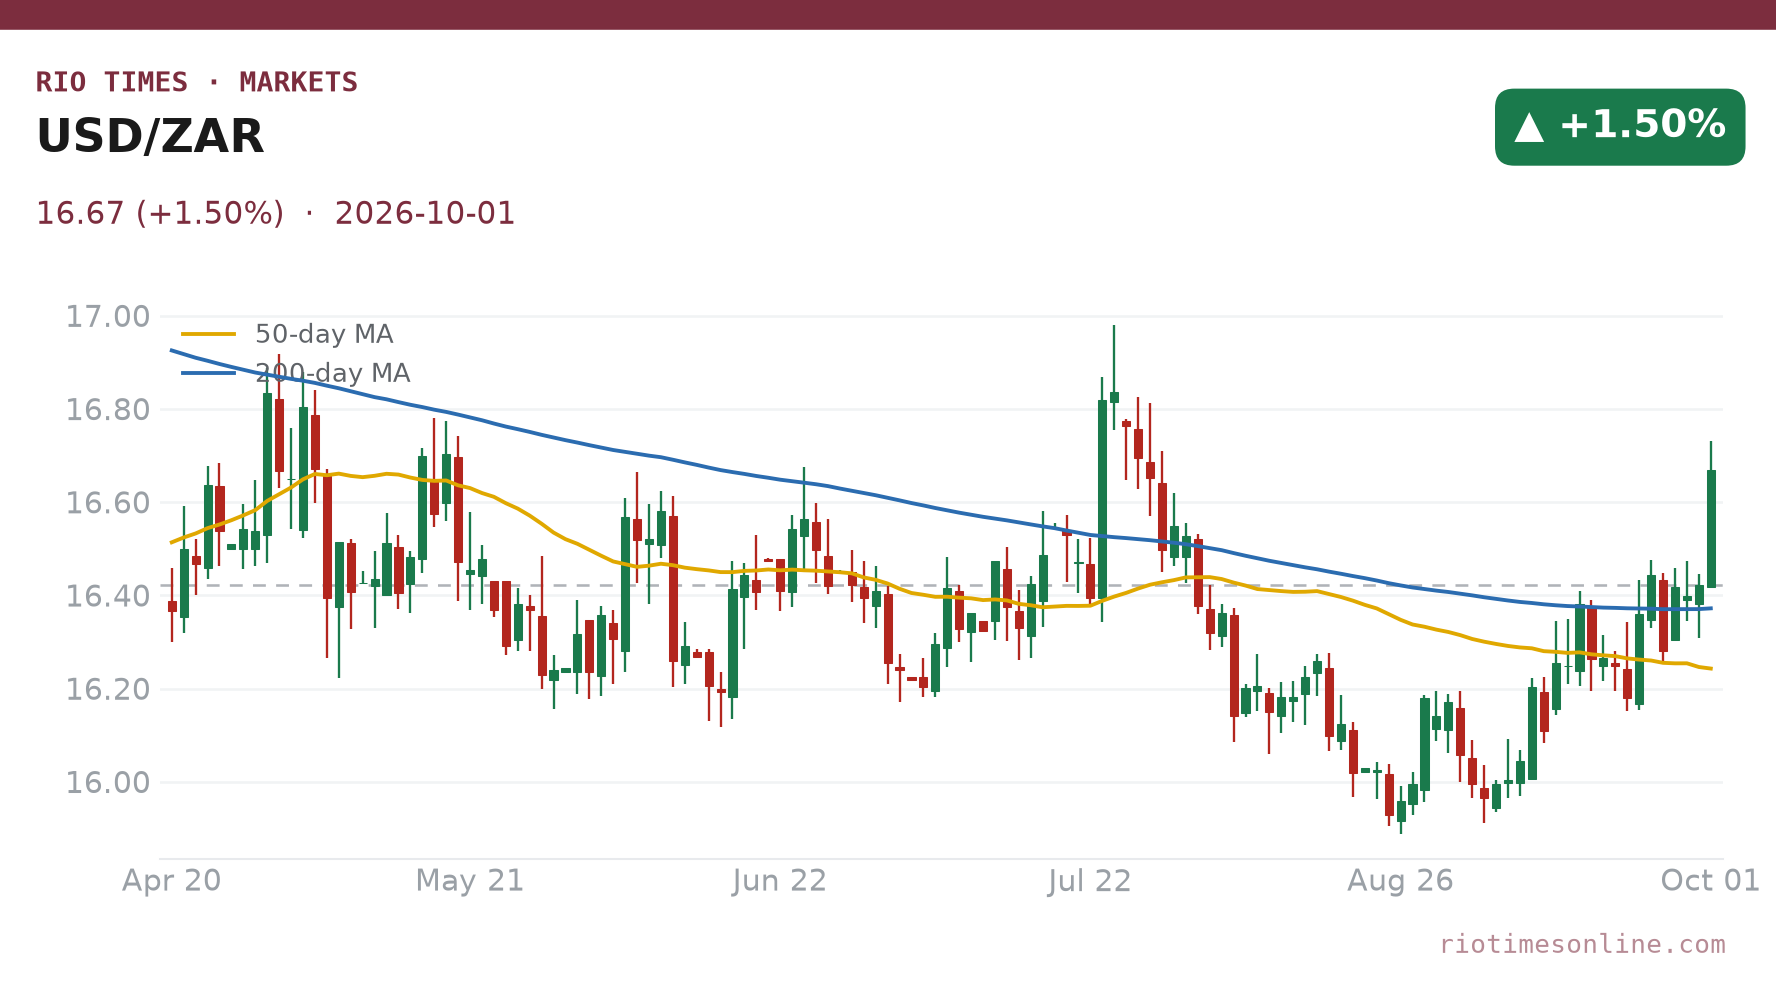
- The rand had its worst day in weeks: the US dollar rose 1.5% to about R16.67 late on Thursday, the rand’s weakest level since late July
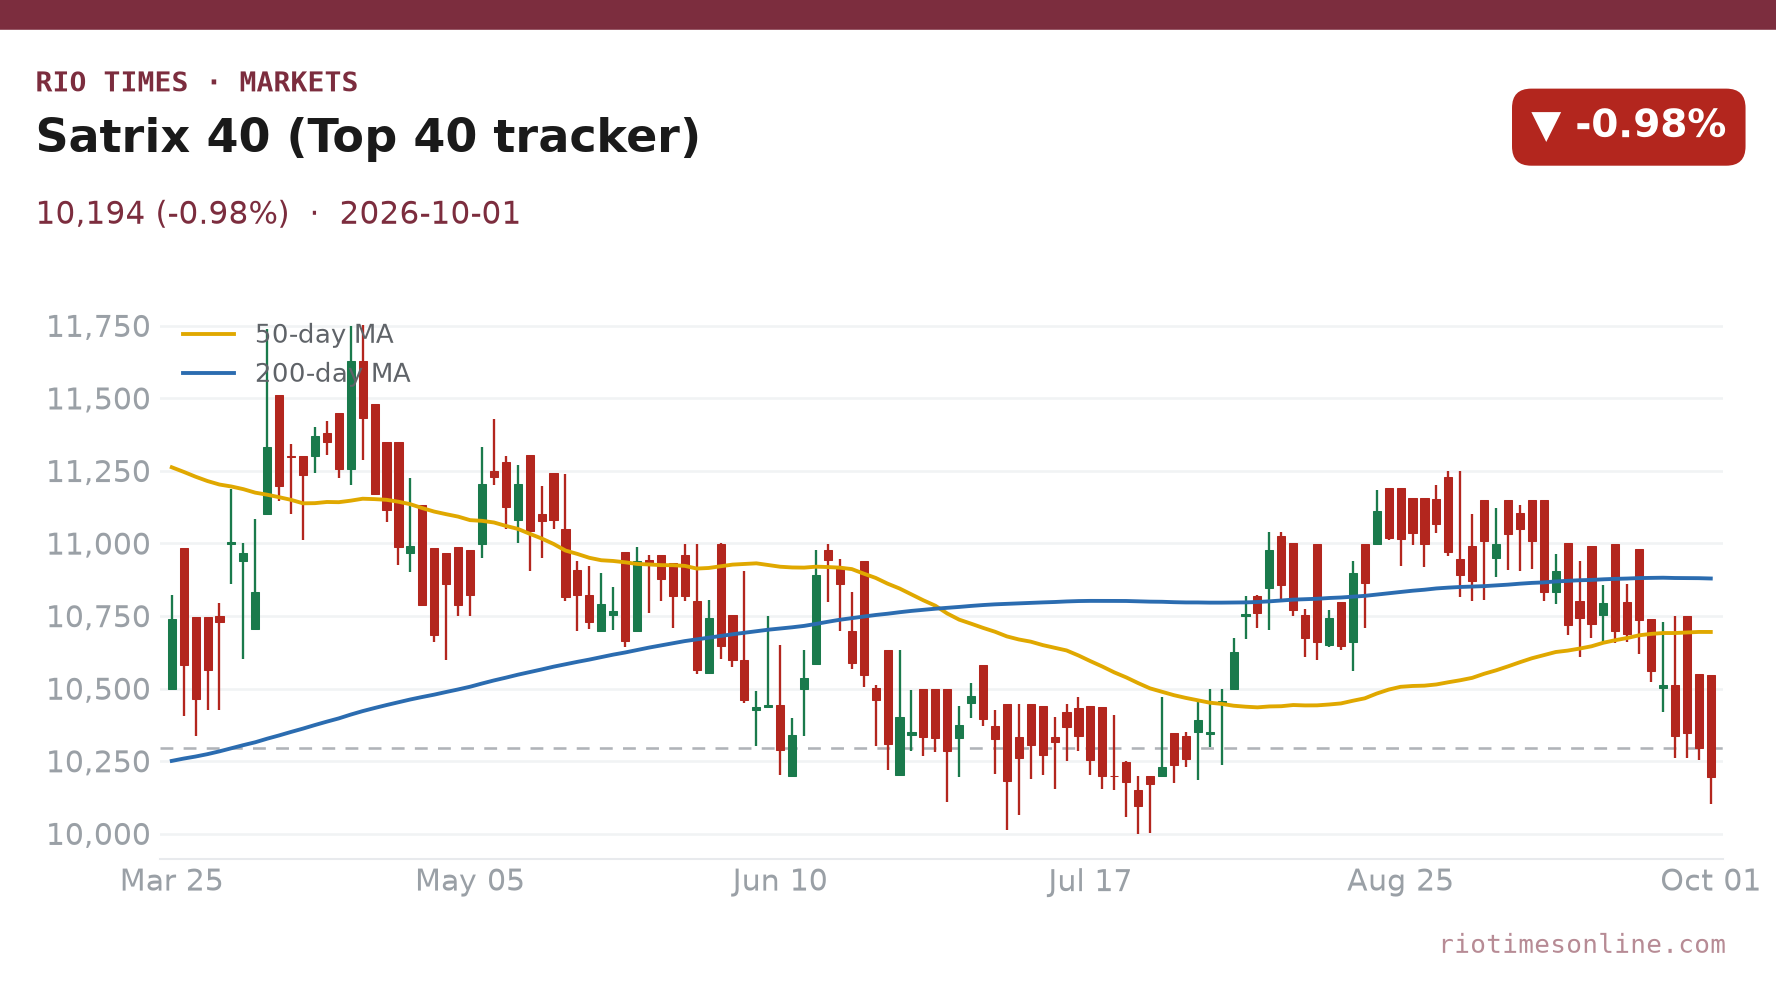
- Johannesburg shares slipped: the Satrix 40 ETF, which tracks the FTSE/JSE Top 40 index, fell 0.98% to R101.94, its lowest close since late July
- Banks led the losses: Capitec fell 3.6% on turnover of R1.95 billion (US$117 million), FirstRand 2.4% and Nedbank 2.3%
- Gold shares held up: Gold Fields was the most-traded stock with R2.04 billion (US$123 million) and rose 0.4%; AngloGold Ashanti gained 1.8%
- Factories returned to growth: the Absa PMI rose 4.9 points to 50.7 in September, its first reading above 50 after three months of contraction
- Car sales beat the gloom: naamsa counted 61,645 new vehicles sold in September, up 12.7% on a year earlier, while exports fell 18.8%
Today’s Focus
South Africa’s rand weakened sharply on Thursday, 1 October 2026, and Johannesburg shares fell with it. The US dollar climbed 1.5% to about R16.67, the rand’s weakest level since late July.
The Satrix 40 ETF, an exchange-traded fund that tracks the FTSE/JSE Top 40 index of the largest listed companies, fell 0.98% to R101.94. Banks did most of the damage. Capitec dropped 3.6%, FirstRand 2.4% and Nedbank 2.3%.
Local data were better than the market mood. The Absa purchasing managers’ index (PMI) for manufacturing rose to 50.7, back above the 50 line that separates growth from contraction. New vehicle sales grew 12.7% on the year.
What matters today. A weaker rand makes imports and fuel dearer for South Africans, but it also cuts the cost of a holiday or an investment for anyone earning dollars. The question for Friday is whether this is a one-day dollar surge or the start of a deeper slide.
01 The session in one read
The Johannesburg Stock Exchange (JSE), Africa’s largest stock market, ended Thursday lower. The Satrix 40 ETF closed at R101.94, down 0.98% from Wednesday’s R102.95. We use the ETF as a tracker because an official closing level for the FTSE/JSE Top 40 index was not available to us at the time of writing.
Breadth was negative. Among 333 JSE instruments with prices on both days, 185 fell and 130 rose. Turnover in the ETF itself reached about 510,000 units, more than double Wednesday’s volume.
The biggest pressure came from banks. Capitec, a fast-growing retail lender, fell 3.6% on R1.95 billion (US$117 million) of trade. FirstRand, Nedbank, Absa and Standard Bank all lost between 1.6% and 2.4%.
The rand had a harder day than the stock market. The US dollar rose 1.5% to about R16.67, after touching R16.73 during the session. The rand also lost 0.8% against the euro and 1.5% against the British pound.
The pattern is consistent with a currency shock passing through to rate-sensitive shares. Banks, which depend on local borrowing costs, fell most, while gold miners, which earn in dollars, rose. The domestic data argue against panic: factory orders recovered and car buyers kept spending. What we cannot confirm from the day’s data is how much of the rand’s fall came from global dollar demand and how much from local selling. The euro also weakened against the dollar, which points to at least a partly global cause.
02 The day’s numbers
| Measure | Level | Change | Read |
|---|---|---|---|
| Satrix 40 ETF (Top 40 tracker) | R101.94 | −0.98% | Lowest close since late July; 15.2% below its 12-month high |
| USD/ZAR | 16.67 | +1.50% | Rand weakens to its softest level since late July |
| EUR/ZAR | 18.74 | +0.82% | Rand also loses ground against the euro |
| GBP/ZAR | 22.01 | +1.53% | Pound gains as much as the dollar |
| Absa PMI (September) | 50.7 | +4.9 pts | Back above 50 after three months below |
| New vehicle sales (September) | 61,645 | +12.7% | Domestic sales up on the year; exports down 18.8% |
Over the past 12 months the Satrix 40 ETF has closed between R100.34 (4 November 2025) and R120.21 (27 February 2026). Thursday’s close leaves it 15.2% below that peak and only 1.6% above the low. In September alone the tracker fell 6.1%.
The dollar has traded between R15.74 (29 January 2026) and R17.53 (4 November 2025) over the same period. At R16.67 it sits roughly in the middle of that range. It has gained 3.3% since the end of August, when it closed at R16.14.
Live Market IntelligenceGlobal Markets — Live Board
Rio Times · Live Market Intelligence
Global Markets — Live Board
| Instrument | Last | Change | YoY | Prev. | High | Low | Volume |
|---|---|---|---|---|---|---|---|
| SPX | 7,751 | +0.29% | — | — | — | — | — |
| NDX | 29,799 | +0.93% | — | — | — | — | — |
| DJI | 53,810 | +0.03% | — | — | — | — | — |
| RUT | 3,041 | +0.46% | — | — | — | — | — |
| US10Y | 4.6760 | -0.17% | — | — | — | — | — |
| VIX | 14.60 | -4.45% | — | — | — | — | — |
| DAX | 26,331 | -0.23% | — | — | — | — | — |
| FTSE | 10,833 | -0.10% | — | — | — | — | — |
| CAC | 8,675 | -0.46% | — | — | — | — | — |
| STOXX | 659.48 | -0.16% | — | — | — | — | — |
| NIKKEI | 67,524 | +0.83% | — | — | — | — | — |
| HSI | 25,440 | -0.83% | — | — | — | — | — |
| KOSPI | 6,579 | +3.68% | — | — | — | — | — |
| CSI300 | 4,691 | +0.58% | — | — | — | — | — |
| NIFTY | 24,436 | -0.15% | — | — | — | — | — |
| TSX | 36,619 | +0.39% | — | — | — | — | — |
| GOLD | 4,461 | +1.78% | +33.20% | 4,383 | 4,503 | 4,421 | 139,824 |
| SILVER | 65.59 | +1.26% | +73.05% | 64.77 | 66.98 | 64.81 | 46,406 |
03 Why it moved: a strong dollar and nervous banks
The main driver was the currency. The rand fell against the dollar, the euro and the pound at the same time. The euro also slipped about 0.8% against the dollar, so part of the move reflects a firmer dollar. Emerging-market currencies such as the rand tend to fall hardest when investors move money into US assets.
South African banks are sensitive to that shift. A weaker rand can push up inflation through fuel and import prices. That raises the risk of higher interest rates, which can increase bad debts. The South African Reserve Bank (SARB) already raised its policy rate by 25 basis points to 7.25% on Wednesday, 23 September.
Gold miners told the opposite story. They sell gold in dollars but pay most of their costs in rand, so a weaker rand lifts their margins. Gold Fields and AngloGold Ashanti were among the most-traded shares and both closed higher.
The cause of Capitec’s 3.6% fall is not clear from the trading data alone. It was the second-most-traded stock of the day, so the selling was broad rather than a thin-market blip.
04 Thursday’s data, one by one
Two local releases landed on Thursday. Both were stronger than the market reaction suggested.
Manufacturing PMI (Absa and BER). The seasonally adjusted Absa PMI rose 4.9 points to 50.7 in September from 45.8 in August. It was the first reading above 50 after three consecutive months of contraction. The new sales orders index rebounded above the neutral mark, and business activity recovered to 49.3 from 40.2.
The PMI’s weak spots. The Bureau for Economic Research (BER), which runs the survey, warned that the signal was not uniformly positive. Employment weakened, order backlogs stayed subdued and purchasing prices rose again. Shipping delays at Durban harbour also inflated the supplier deliveries component.
New vehicle sales (naamsa). The industry body naamsa reported domestic sales of 61,645 units in September, up 12.7% from 54,706 a year earlier. Passenger car sales rose 14.7% to 44,291. Light commercial vehicles, including bakkies (pick-up trucks), rose 9.6% to 14,361.
Exports fell. Vehicle exports dropped 18.8% to 31,473 units. Exports were the soft spot in an otherwise strong month. Our full report is here.
05 The day’s movers
| Driver | Close | Change | Note |
|---|---|---|---|
| Gold Fields (GFI) | R598.95 (US$35.93) | +0.4% | Most-traded stock: R2.04bn (US$123m) |
| Capitec (CPI) | R4,188.00 (US$251.24) | −3.6% | R1.95bn (US$117m) traded; heaviest bank loss |
| AngloGold Ashanti (ANG) | R1,565.35 (US$93.91) | +1.8% | R1.80bn (US$108m) traded; weak rand helps |
| MTN Group (MTN) | R180.16 (US$10.81) | +1.4% | R1.39bn (US$83m) traded; telecoms gain |
| FirstRand (FSR) | R89.51 (US$5.37) | −2.4% | R1.23bn (US$74m) traded |
| Nedbank (NED) | R283.34 (US$17.00) | −2.3% | R420m (US$25m) traded |
The table shows a market split by currency exposure. Gold Fields alone traded R2.04 billion (US$123 million), more than any other stock. AngloGold Ashanti added R1.80 billion (US$108 million) and rose 1.8%.
Banks went the other way. Capitec, FirstRand and Nedbank together traded about R3.6 billion (US$216 million), and all three closed lower. Standard Bank fell 1.6% and Absa 2.0%. For readers who follow the companies, our JSE Limited profile explains how the exchange itself is run.
Outside these groups, retailer SPAR rose 4.5% on R147 million (US$9 million) of turnover. Telecoms group MTN gained 1.4% on R1.39 billion (US$83 million) of trade.
06 The regional scoreboard
| Index | Country | Change |
|---|---|---|
| Satrix 40 ETF (Top 40 tracker) | South Africa | −0.98% |
| EGX30 | Egypt | +2.24% |
Egypt’s EGX30 index rose 2.24% to 53,055.03 points, a sharp contrast with Johannesburg. Cairo’s gain shows that the day’s selling did not spread across the continent.
Closing data for Nairobi and Casablanca were not available to us at the time of writing, so they are left out rather than estimated. On the evidence available, the rand’s fall was a South African currency story rather than a pan-African sell-off.
07 The technical picture
The Satrix 40 ETF closed at R101.94, only 1.6% above its 12-month closing low of R100.34. A fall below that mark would put the tracker at its weakest level in a year. The session low of R101.01 is the first line to watch.
For the rand, the next marker is the late-July closing high for the dollar. The dollar closed at R16.84 on 24 July 2026. A move through that level would leave the rand at its weakest since early April.
On the upside for the rand, a return below R16.42, Wednesday’s close, would erase Thursday’s loss. That would need a calmer dollar and steady local data.
08 What to watch
- Rand at R16.84: The dollar’s late-July closing high is the next test; a break would add pressure on fuel prices and inflation
- Bank shares: Capitec, FirstRand and Nedbank led Thursday’s losses; a second day of selling would signal more than a currency reaction
- Gold miners: Gold Fields and AngloGold Ashanti benefit from a weak rand; their moves show how much of the currency fall investors expect to last
- Manufacturing follow-through: The BER said a sustained move above 50 is needed to confirm a recovery; official August factory output data are still outstanding
- Durban port delays: Shipping bottlenecks flagged in the PMI survey could weigh on exporters, including carmakers whose shipments fell 18.8%
Background: Johannesburg Stock Exchange (JSE): How It Works, Who Runs It and What Issuers Must Disclose. More from the region: South Africa news and Gold Fields after its rebuffed Australian bid.
Frequently Asked Questions
What is the Satrix 40 ETF?
It is an exchange-traded fund listed on the Johannesburg Stock Exchange that tracks the FTSE/JSE Top 40 index, which covers the 40 largest companies on the exchange.
Why did the rand weaken on October 1, 2026?
The rand fell against the dollar, the euro and the pound at the same time. The dollar rose 1.5% to about R16.67, the rand’s weakest level since late July. The exact trigger is not clear from the day’s data.
Why did South African bank shares fall?
A weaker rand can raise inflation and interest-rate risk, which weighs on lenders. Capitec fell 3.6%, FirstRand 2.4% and Nedbank 2.3% on Thursday.
What did the Absa PMI show for September?
The Absa manufacturing PMI rose 4.9 points to 50.7, its first reading above 50 after three months of contraction, led by a rebound in new orders.
Source: RT live market data, close of Thursday 1 October 2026 (Satrix 40 ETF used as Top 40 tracker; rand rates late on Thursday); exchange figures from the JSE; PMI from the Bureau for Economic Research and Absa; vehicle sales from naamsa; policy rate from the South African Reserve Bank.
This article was produced by The Rio Times’ automated newsroom system. How we use AI · Report an error
LatAm Markets: Live Signals → — real-time movers, turnover leaders and FX across Latin America.
Read More from The Rio Times